
Tuesday, September 21, 2021
Will Hot Air Keep the United States Natural Gas Fund Climbing?
تم إعداد هذا المنشور من قبل سنشري للاستشارات
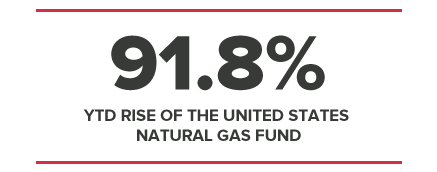
The United States Natural Gas Fund [UNG] has been rallying since the start of September, fuelled by surging natural gas prices amid strong demand. The fund has rallied 15.2% since the end of August (through 17 September), marking a year-to-date climb of 91.8%.
Because the United States Natural Gas Fund is designed to track the movements of natural gas prices, its net asset value reflects the daily price changes in percentage terms of the price of natural gas delivered at the Henry Hub, a distribution hub in Louisiana.
The natural gas spot price at Henry Hub has risen from an average of $3.84MMBtu (or metric million British thermal units) in July to $5.09MMBtu on 13 September – its highest price since February 2014, according to Yahoo Finance. According to the US Energy Information Administration (EIA), the price will average out at $3.42 for 2021, up from an average of $2.03 in 2020.
Growth in liquefied natural gas exports and rising domestic natural gas consumption in sectors outside of electric power have been the main drivers, according to Gas Compressionmagazine. Other factors include extreme weather, such as Hurricane Ida, blasting output in the Gulf of Mexico and global economies re-opening post-pandemic.
Another key driver is a lack of supply. The amount of gas storage is 7.6% below the five-year average, according to the EIA.
United States Natural Gas Fund soars to new high
The United States Natural Gas Fund price had climbed from $9.45 at the close on 4 January to $11.26 at the close on 21 June. The fund then soared to hit a 52-week high of $19.71 during intraday trading on 15 September before closing at $17.65 on 17 September.
According to Yahoo Finance, the United States Natural Gas Fund’s year-to-date total daily return is 47.2% (as of 20 September). The fund also has total net assets of $298m.
In comparison, the iShares Stoxx Europe 600 Oil & Gas UCITS ETF [EXH1.DE] shares have risen from €24.01 at the close on 4 January to €26.25 at the close on 17 September.
European gas prices have also soared this year. Reutersattributes this to low gas storage levels, decreased Russian supplies, growing demand from Asia (particularly China), lower renewables output and nuclear maintenance outages.
According to gas supplier Gazprom Europe, gas in storage is 22.9 billion cubic metres below normal levels.
European benchmark futures for delivery in January 2022, when heating demand is expected to peak, have hit a record €66 per megawatt-hour, up from €16 a year ago.
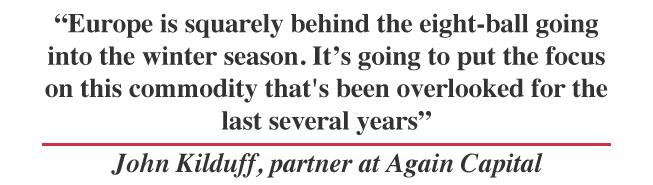
“Europe is squarely behind the eight-ball going into the winter season. It’s going to put the focus on this commodity that's been overlooked for the last several years,” John Kilduff, partner at Again Capital, said, as reported by CNBC.
Weather dependent
According to the EIA, prices in the US are expected to drop next year, with the Henry Hub price set to average $3.08MMBtu because of rising natural gas production.
But the fundamentals for growth in the United States Natural Gas Fund and iShares Stoxx Europe 600 Oil & Gas UCITS ETF remain strong.
The real indicator will be the severity of winter weather on both sides of the Atlantic. Some experts have warned that US gas prices could double if there is a particularly brutal cold snap, with European prices also vulnerable.
They could also affect each other, argues Francisco Blanch, head of commodities and derivatives strategy research at Bank of America Merrill Lynch. “The US is supposed to be an island, but in the last three or four years, there's an increasing link between the US and global market,” Blanch told CNBC. “We’ve gone from 50% correlation to 95% correlation. The US market is being dragged around by this.”
Christopher Looney, global head of institutional commodity sales at RBC Capital Markets, added: “We lean toward a lot of risks for price spikes, rather than higher and higher sustained prices.”
But Goldman Sachs differs. “Anything closer to [or colder than] a full standard deviation from the average would likely trigger a price spike to cause demand destruction with gas above $10MMBtu,” its analysts said. Gas prices haven’t been at that level since 2008.
Looking longer-term in Europe, the new Nord Stream 2 pipeline transporting natural gas from Russia to Europe could improve supply levels. However, there are political concerns around the pipeline and the control Russia could have in increasing or decreasing supply.
Increased shale production could also help the US gas supply with better renewables output as the winter wind blows.
There are many imponderables heading into winter, but demand for natural gas remains strong. The EIA said natural gas should provide 35% of power generation in 2021 and 34% in 2022.
Source: This content has been produced by Opto trading intelligence for Century Financial and was originally published on cmcmarkets.com/en-gb/opto
Disclaimer: Past performance is not a reliable indicator of future results.
The material (whether or not it states any opinions) is for general information purposes only and does not take into account your personal circumstances or objectives. Nothing in this material is (or should be considered to be) financial, investment or other advice on which reliance should be placed. No opinion given in the material constitutes a recommendation by Century Financial or the author that any particular investment, security, transaction or investment strategy is suitable for any specific person.
Century Financial does not endorse or offer opinion on the trading strategies used by the author. Their trading strategies do not guarantee any return and Century Financial shall not be held responsible for any loss that you may incur, either directly or indirectly, arising from any investment based on any information contained herein.


تنظمها هيئة الأوراق المالية والسلع
سنشري للاستشارات المالي ش.ذ.م.م


تصل إلينا:
-
دبي
الطابق رقم 6, مبنى رقم 4, ساحة إعمار دبي
وسط مدينة دبي، ص.ب: 65777،
دبي، الإمارات العربية المتحدة -
أبوظبي
مكتب 3014، الطابق 30
برج طموح، مبنى 12، مارينا سكوير،
جزيرة الريم، أبوظبي - +971 (4) 356 2800
- info@century.ae

Century Financial is the presenting sponsor of

يتضمن التداول في منتجات المشتقات باستخدام الرافعة المالية خارج البورصة، بما في ذلك العقود مقابل الفروقات وعقود الصرف الفوري للعملات الأجنبية، وينطوي على مخاطر خسارة كبيرة قد تفوق الودائع وربما لا يناسب جميع المستثمرين. وتُعد منتجات المشتقات المالية خارج البورصة / العقود مقابل الفروقات هي أدوات مالية معقدة لا تمنح أي مطالبة أو حق إلى الأداة المالية الأساسية. والتعاملات بهذه الأدوات خطرة جداً، ويتعين عليك التداول فقط برأس المال الذي يمكنك تحمّل خسارته. وقبل أن تقرر التداول في هذه المنتجات، يتعين عليك النظر في أهدافك الاستثمارية وتحمّلك للمخاطر ومستوى خبرتك. وتبعاً لذلك، يتعين عليك أن تتأكد من فهمك للمخاطر ذات الصلة وأن تطلب مشورة مستقلة من المتخصصين إن لزم الأمر.
سنشري للاستشارات والتحليل المالي ش.ذ.م.م (سنشري) هي شركة مرخصة حسب الأصول ومنظمة من قِبل هيئة الأوراق المالية والسلع في دولة الإمارات العربية المتحدة (هيئة الأوراق المالية والسلع) بموجب الرخصة رقم 20200000028، 20200000081و301044 لمزاولة أنشطة وسيط التداول في الأسواق العالمية، ووسيط التداول للمشتقات المالية خارج البورصة والعملات في السوق الفورية، وخدمات التعريف والإحالة والاستشارات المالية والتحليل المالي، والترويج. كما أن سنشري هي شركة ذات مسؤولية محدودة تأسست بموجب قوانين دولة الإمارات العربية المتحدة ومسجلة لدى دائرة التنمية الاقتصادية في دبي (رقم تسجيلها 768189) ويقع مكتبها المعتمد في 601، الطابق 6، المبنى 4، إعمار سكوير، داون تاون، دبي، الإمارات العربية المتحدة، ص.ب: 65777.
يتم تقديم أي محتوى متاح على موقعنا الإلكتروني فقط لتوفير المعلومات وتثقيف الزوار. ولا يجوز تحت أي ظرف من الظروف تفسير أيً من هذا المحتوى على أنه عرض أو توصية أو مشورة أو التماس لشراء أو بيع الأوراق المالية أو غيرها من المنتجات المالية.
معلومات هذا الموقع الإلكتروني غير مخصصة للاستخدام من قِبل أي شخص مقيم خارج دولة الإمارات العربية المتحدة أو حيث يخالف هذا الاستخدام القوانين أو اللوائح المحلية.
