
Thursday, June 18, 2020
Mega-cap share prices: How Apple and co took over the S&P 500
By Century Financial in 'Brainy Bull'


The share price performance of mega-cap stocks Alphabet, Apple, Amazon, Facebook and Microsoft has been relentless, but has their market dominance over the S&P 500 gone too far?
The S&P 500 shed 5.9% last week, closing at 3,041.31 on 12 June — its largest weekly loss since March, according to reports. The pullback was helped in no small part by the drop in share price for a number of the index’s top stocks.
Although Amazon [AMZN] and Apple’s [AAPL] share price actually bucked the trend, up 0.8% and 1.6% respectively, the share prices of Alphabet [GOOGL], Facebook [FB] and Microsoft [MSFT], lost a combined $35bn in market valuation between 8 and 12 June, as concerns over a new wave of COVID-19 infections started to build.

The biggest loser in the group, Alphabet, saw its share price drop 2.4% throughout the week. Facebook’s the share price dropped 1.2%, while Microsoft saw its share price slip by 0.3%. Even Amazon and Apple’s share price gains were nominal relative to recent activity.
This news would not be particularly concerning if it were not for the fact that Apple, Amazon, Facebook, Alphabet and Microsoft constitute more than a fifth of a major index, of more than 500 large-cap stocks. So, is this growing gulf between mega-cap tech share prices set to cause wider issues?
Growing dominance
The S&P 500 is supposed to hold the 500 most valuable companies in the US. However these days, just five companies’ share prices account for a massive 22% of the 505 strong index. The top 10 companies, meanwhile, account for 25.8% of the index’s weighting.
The market valuations of the five largest constituents — which in order are Microsoft, Apple, Amazon, Facebook and Alphabet — was collectively worth $5.6trn at the end of May. Apple’s market cap as of 16 June’s close stands at $1.53 trillion, a 57% gain in Apple’s share price since a year-to-date low on 23 March has seen the company amass this colossus valuation.

The combined value of these five stocks would represent 22.2% of the market capitalisation of $25.24trn as of 31 May, according to data by YCharts. This has grown from the 17.5% that CNBC had recorded at the end of January.
Meanwhile, the technology sector made up the majority of the S&P 500’s holdings at 26.2% as of 31 May.
Since the pandemic-induced market crash in March, tech share prices have rallied on the rising demand for essential online services. A third of stocks that made up the Russell 3000 were down by more than 30%, and half by 20% or more, while the index itself only dropped by 11% between mid-February and the start of June, the Financial Times reports.
The fear among many is that technology — also the largest sector in the Rusell 3000 index by market capitalisation — is masking underperformance, and creating what Binky Chadha, chief strategist at Deutsche Bank, calls the imbalance “a tale of two stock markets”.

Indeed, the trend towards digitisation has left tech’s largest companies flush with cash, giving them fuel to expand into new industries. Facebook has entered e-commerce, Amazon has made a play at gaming and autonomous vehicles, and Microsoft has gone on a cloud acquisition spree.
Meanwhile, the remaining bulk of listed companies are trying to raise capital to see them through the downturn.
The impact of narrow breadth
The same high levels of tech concentration in the S&P 500 happened back at the peak of the dotcom bubble in the 2000s when it hit 18%, Goldman Sachs strategist David Kostin observed.
In a note to clients, the strategist pointed out the dispersion in recent returns. At the end of April, he noted that the S&P 500 is just 17% off its all-time high of 3,386.15 on 19 February, while the median stock was 28% off its high.
With the stock market experiencing such narrow breadth — which is the measure of how many stocks are advancing relative to those that are declining — and high dispersion, it could be signalling a downturn based on past performance.
Goldman Sachs pointed to breadth narrowing before the tech bubble and recessions in 1990 and 2008, as well as prior to the 2011 and 2016 economic slowdowns. They added that sharply narrowing breadth has been an indicator for both below-average returns and “larger than average prospective drawdowns.”
Similar to past events, the three-month rally across US equities that has followed on from March’s crash is starting to show signs of fatigue.
For Kostin, a correction could be because “a handful of market leaders” begin to question overblown valuations and “investor crowding” are supported by fundamental earnings strength.
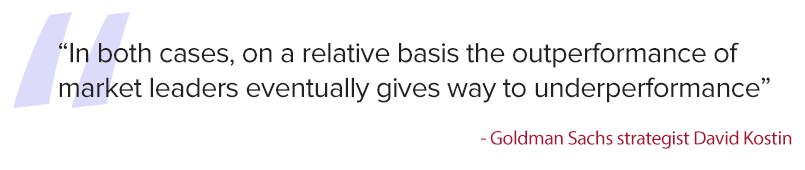
“In these cases, the market leaders 'catch down' to weaker peers,” Kostin wrote. “In other cases, an improving economic outlook and strengthening investor sentiment helps laggards 'catch up' to the market leaders. In both cases, on a relative basis the outperformance of market leaders eventually gives way to underperformance,” he said.
Source: This content has been produced by Opto trading intelligence for Century Financial and was originally published on cmcmarkets.com/en-gb/opto
Disclaimer: Past performance is not a reliable indicator of future results.
The material (whether or not it states any opinions) is for general information purposes only and does not take into account your personal circumstances or objectives. Nothing in this material is (or should be considered to be) financial, investment or other advice on which reliance should be placed. No opinion given in the material constitutes a recommendation by Century Financial or the author that any particular investment, security, transaction or investment strategy is suitable for any specific person.
Century Financial does not endorse or offer opinion on the trading strategies used by the author. Their trading strategies do not guarantee any return and Century Financial shall not be held responsible for any loss that you may incur, either directly or indirectly, arising from any investment based on any information contained herein.


Regulated by SCA
Century Financial Consultancy LLC


Reach us:
-
Dubai
6th Floor, Building 4, Emaar Square,
Downtown Dubai, P.O. Box 65777,
Dubai, United Arab Emirates -
Abu Dhabi
Office 3014, 30th Floor
Tamouh Tower, Building 12, Marina Square,
Al Reem Island, Abu Dhabi - +971 (4) 356 2800
- info@century.ae

Disclaimer: Trading in financial products carries risk. Trading in leveraged Over-The-Counter (OTC) Derivative products (including Contracts for Difference (CFDs) and spot foreign exchange contracts) involves a significant risk of loss which can exceed deposits and may not be suitable for all investors. OTC Derivative products / CFDs are complex financial instruments that do not confer any claim or right to the underlying financial instrument. Transactions in these instruments are very risky, and you should trade only with the capital you can afford to lose. Before deciding to trade on these products, you should consider your investment objectives, risk tolerance and your level of experience. Accordingly, you should ensure that you understand the risks involved and seek independent advice from professionals, if necessary.
Century Financial Consultancy LLC (CFC) is duly licensed and regulated by the Securities and Commodities Authority of UAE (SCA) under license numbers 20200000028 and, 20200000081 and 301044 to practice the activities of Trading broker in the international markets, Trading broker of the OTC derivatives and currencies in the spot market, Introduction, Financial Consultation and Financial Analysis, and Promotion. CFC is a Limited Liability Company incorporated under the laws of UAE and registered with the Department of Economic Development of Dubai (registration number 768189). CFC has its registered office at 601, Level 6, Building no. 4, Emaar Square, Downtown, Dubai, UAE, PO Box 65777.
Any content available on our website is presented solely to provide information and educate visitors. Under no circumstances is any of this content meant to be construed as an offer, recommendation, advice, or solicitation to buy or sell securities or other financial products.
This website's information is not intended for use by anybody residing outside UAE or where such use would violate local laws or regulations.
