Stock chart patterns are an important trading tool which should be utilised as part of your technical analysis. From beginners to professionals, chart patterns play an integral part when looking for market trends and predicting movements. They can be used to analyse all markets including forex, shares, commodities and more.
Trading chart patterns often form shapes, which can help predetermine price breakouts and reversals. Recognising chart patterns will help you gain a competitive advantage in the market, and using them will increase the value of your future technical analysis. Before starting your chart pattern analysis, it is important to familiarize yourself with the different types of trading charts.
11 essential stock chart trading patterns
The following stock chart patterns are the most recognizable and common chart patterns to look out for when using technical analysis to trade shares, forex and other markets. Our guide of the 11 most important stock chart trading patterns can be applied to most financial markets and could be a good way to start your technical analysis.
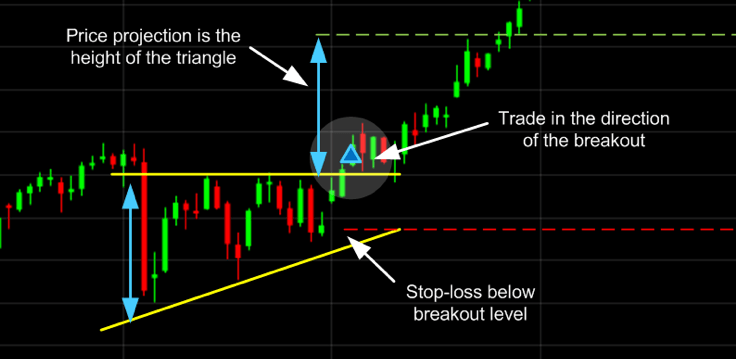
1. Ascending triangle
The ascending triangle is a bullish ‘continuation’ chart pattern that signifies a breakout is likely where the triangle lines converge. To draw this pattern, you need to place a horizontal line (the resistance line) on the resistance points and draw an ascending line (the uptrend line) along the support points.
2. Descending triangle
Unlike ascending triangles, the descending triangle represents a bearish market downtrend. The support line is horizontal, and the resistance line is descending, signifying the possibility of a downward breakout.

3. Symmetrical triangle
For symmetrical triangles, two trend lines start to meet which signifies a breakout in either direction. The support line is drawn with an upward trend, and the resistance line is drawn with a downward trend. Even though the breakout can happen in either direction, it often follows the general trend of the market.

4. Pennant
Pennants are represented by two lines that meet at a set point. They are often formed after strong upward or downward moves where traders pause and the price consolidates, before the trend continues in the same direction.
5. Flag
The flag stock chart pattern is shaped as a sloping rectangle, where the support and resistance lines run parallel until there is a breakout. The breakout is usually the opposite direction of the trendlines, meaning this is a reversal pattern.
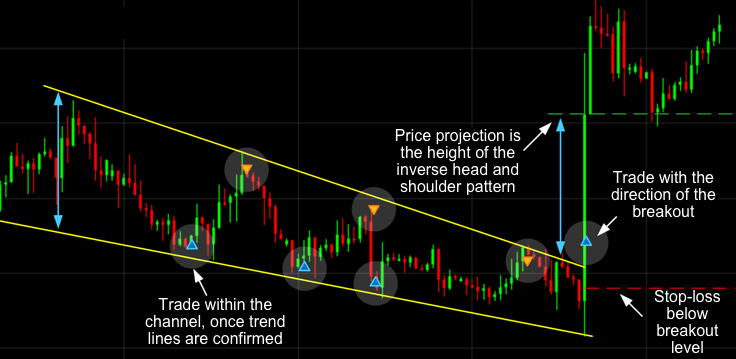
6. Wedge
A wedge represents a tightening price movement between the support and resistance lines, this can be either a rising wedge or a falling wedge. Unlike the triangle, the wedge doesn’t have a horizontal trend line and is characterised by either two upward trend lines or two downward trend lines.
For a downward wedge it is thought that the price will break through the resistance and for an upward wedge, the price is hypothesised to break through the support. This means the wedge is a reversal pattern as the breakout is opposite to the general trend.
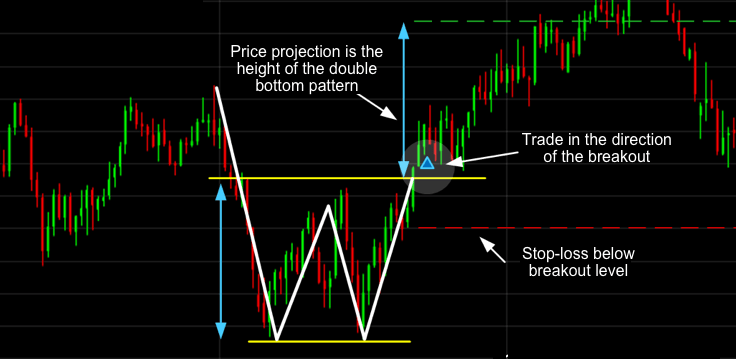
7. Double bottom
A double bottom looks similar to the letter W and indicates when the price has made two unsuccessful attempts at breaking through the support level. It is a reversal chart pattern as it highlights a trend reversal. After unsuccessfully breaking through the support twice, the market price shifts towards an uptrend.
8. Double top
Opposite to a double bottom, a double top looks much like the letter M. The trend enters a reversal phase after failing to break through the resistance level twice. The trend then follows back to the support threshold and starts a downward trend breaking through the support line.

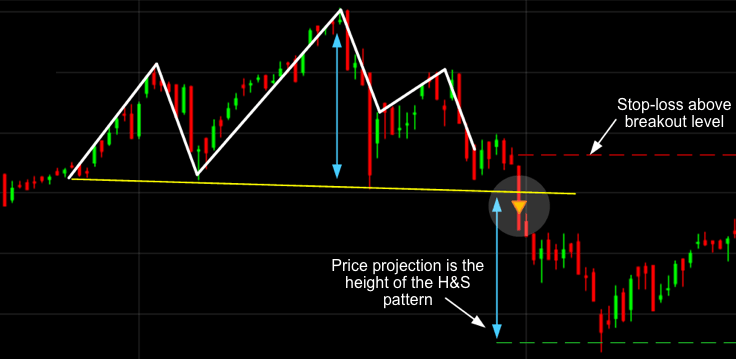
9. Head and shoulders
The head and shoulders trading pattern tries to predict a bull to bear market reversal. Characterised by a large peak with two smaller peaks either side, all three levels fall back to the same support level. The trend is then likely to breakout in a downward motion.
10. Rounding bottom
A rounding bottom or cup usually indicates a bullish upward trend. Traders can buy at the middle of the U shape, capitalising on the bullish trend that follows as it breaks through the resistance levels.
11. Cup and handle
The cup and handle is a well-known continuation stock chart pattern that signals a bullish market trend. It is the same as the above rounding bottom, but features a handle after the rounding bottom. The handle resembles a flag or pennant, and once completed can see the market breakout in a bullish upwards trend.
Trading chart types
The platform has several chart types on offer including the popular line, bar (OHLC) and candlestick charts. The best chart for you depends on how you like your information displayed and your trading level.
Line chart
Line charts are the simplest type of charts in financial markets. There is no high or low point specified, unlike bar and candlestick charts, and they are instead based on lines drawn directly between closing prices. This chart type is commonly utilised in reports and presentations to show general price movements, however they often lack granular information, such as chart patterns when compared to other trading chart options.

Bar chart (OHLC)
Bar charts or OHLC charts (open high low close chart), unlike line charts show both the opening and closing price, as well as the highs and lows for the specified period. As opposed to a line, the data is more in depth and uses a single vertical bar. The top of the bar represents the highest price achieved for the specified time frame and the bottom of the bar the lowest price. Additionally, a horizontal bar extends to the left of the bar which denotes the opening price and a short horizontal bar to the right which signifies the closing price. The direction of a trade can be seen from the colour of the bar. A green bar indicates that the closing price was higher than the open, however red indicates that the opening price was higher than the close.

Candlestick chart
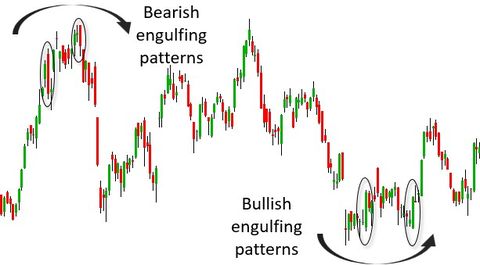
Candlestick charts are very similar to bar charts but are more popular with traders. Like bar charts the candlestick’s highest wick is the highest price in that period and the lowest wick is the lowest price. The candlestick body represents the difference between the opening and closing price, which can help to indicate price movements. The candlestick is green or red subject to a bullish or bearish movement respectively. A bullish movement is an uptrend, whilst a bearish movement shows a downtrend.
Many chart patterns can be represented best on candlestick charts, as candlestick charts have their own set of chart patterns alongside the ones outlined in this article.

How to easily recognise chart patterns
Chart patterns can sometimes be quite difficult to identify on charts when you’re a beginner and even when you’re a professional trader. The pattern recognition scanner helps identify chart patterns automatically saving you time and effort. The pattern recognition scanner collates data from over 120 of the most popular products and alerts you to potential technical trading opportunities across multiple time intervals.
Using popular patterns such as triangles, wedges and channels, coupled with bespoke star rating system, the pattern recognition scanner updates every 15 minutes to continuously highlight potential emerging and completed technical trade set-ups.
Stock chart patterns app
The online trading platform is also available on mobile and tablet devices, thanks to advancements in technology. This is available for both Android and iOS software.
Expand your knowledge on chart patterns
What are candlestick charts?
Advanced chart technical analysis


FAQs
How many types of chart patterns are there?
There are three key chart patterns used by technical analysis experts. These are traditional chart patterns, harmonic patterns and candlestick patterns (which can only be identified on candlestick charts).
What chart patterns are best in forex?
The head and shoulders chart pattern and the triangle chart pattern are two of the most common patterns for forex traders. They occur more regularly than other patterns and provide a simple base to direct further analysis and decision-making.
How do stock chart patterns work?
Chart patterns work by representing the market’s supply and demand. This causes the trend to move in a certain way on a trading chart, forming a pattern. However, chart pattern movements are not guaranteed, and should be used alongside other methods of market analysis. Chart patterns can be identified on pattern recognition scanner.
What are reversal and continuation patterns?
When a price signal changes direction, it is a reversal pattern. However, when a price trend continues in the same direction it is a continuation pattern. Technical analysts have long used chart patterns as a method for forecasting price movements and trend reversals. You can use pattern recognition scanner to help inform your analysis.
Source: CMC Markets UK
Disclaimer: Century Financial Consultancy LLC (“CFC”) is Limited Liability Company incorporated under the Laws of UAE and is duly licensed and regulated by the Emirates Securities and Commodities Authority of UAE (SCA). This document is a marketing material and is for informational purposes only and must not be construed to be an advice to invest or otherwise in any investment or financial product. CFC does not guarantee as to adequacy, accuracy, completeness or reliability of any information or data contained herein and under no circumstances whatsoever none of such information or data be construed as an advice or trading strategy or recommendation to deal (Buy/Sell) in any investment or financial product. CFC is not responsible or liable for any result, gain or loss, based on this information, in whole or in part.
PLEASE READ THE FOLLOWING TERMS AND CONDITIONS OF ACCESS FOR THE PUBLICATION BEFORE THE USE THEREOF.
By use of the publication and continuing to access the publication, you accept these terms and conditions and undertake to be bound by the acceptance. CFC reserves the right to amend, remove, or add to the publication and Disclaimer at any time without any prior notice to you. Such modifications shall be effective immediately. Accordingly, please continue to review this Disclaimer whenever accessing, or using the publication. Your access of, and use of the publication, after modifications to the Disclaimer will constitute your acceptance of the terms and conditions of use of the publication, as modified. If, at any time, you do not wish to accept the content of this Disclaimer, you may not access, or use the publication. Any terms and conditions proposed by you which are in addition to or which conflict with this Disclaimer are expressly rejected by CFC and shall be of no force or effect.
No information as given herein by CFC in this publication should be construed as an offer, recommendation or solicitation to purchase or dispose of any securities/financial instruments/products or to enter in any transaction or adopt any hedging, trading or investment strategy. Neither this publication nor anything contained herein shall form the basis of any contract or commitment whatsoever. Distribution of this publication does not oblige CFC to enter into any transaction.
The content of this publication should not be considered legal, regulatory, credit, tax or accounting advice. Anyone proposing to rely on or use the information contained in the publication should independently verify and check the accuracy, completeness, reliability and suitability of the information and should obtain independent and specific advice from appropriate professionals or experts regarding information contained in this publication. CFC cannot be held responsible for the impact of any transactional costs or any taxes as may be applicable on transactions.
Information contained herein is based on various sources, including but not limited to public information, annual reports and statistical data that CFC considers reliable. However, CFC makes no representation or warranty as to the accuracy or completeness of any report or statistical data made in or in connection with this publication and accepts no responsibility whatsoever for any loss or damage caused by any act or omission taken as a result of the information contained in this publication. The articles does not take into account the investment objectives, financial situations and specific needs of recipients. The recipient of this publication must make its own independent decisions regarding whether this communication and any securities or financial instruments mentioned herein, is appropriate in the light of its existing portfolio holdings and/or investment needs.
This document is a marketing material and has been prepared by individual(s), marketing and/or research personnel of CFC. It has not been prepared in accordance with legal requirements designed to promote the independence of investment research and as such is purely a marketing communication. In this publication, any opinions, news, research, analysis, prices, or other information constitute is a general market commentary, and do not constitute the opinion or advice of CFC or any form of personal or investment advice. CFC neither endorses nor guarantees offerings of third party, nor is CFC responsible for the content, veracity or opinions of third-party speakers, presenters, participants or providers. CFC will not accept liability for any loss or damage, including without limitation to, any loss of profit, which may arise directly or indirectly from use of or reliance on such information.
Charts, graphs and related data or information provided in this publication are intended to serve for illustrative purposes only. The information contained in this publication is prepared as of a particular date and time and will not reflect subsequent changes in the market or changes in any other factors relevant to their determination. All statements as to future matters are not guaranteed to be accurate. CFC expressly disclaims any obligation to update or revise any forward-looking statements to reflect new information, events or circumstances after the date of this publication or to reflect the occurrence of unanticipated events.
Staff members/employees of CFC may provide/present oral or written market commentary or analysis to you that reflect opinions that are contrary to the opinions expressed in this research and may contain insights and reports that are inconsistent with the views expressed in this publication. Neither CFC nor any of its affiliates, group companies, directors, employees, agents or representatives assume any liability nor shall they be made liable for any damages whether direct, indirect, special or consequential including loss of revenue or profits that may arise from or in connection with the use of the information provided in this publication.
Information or data provided by means in this publication may have many inherent limitations, like module errors or lack accuracy in its historical data. Data included in the publication may rely on models that do not reflect or take into account all potentially significant factors such as market risk, liquidity risk, credit risk etc.
The use of our information, products and services should be on your own due diligence and you agree that CFC is not liable for any failure to achieve desired return on investment that is in any manner related to availing of services or products of CFC and use of our information, products and services. You acknowledge and agree that past investment performance is not indicative of the future performance results of any investment and that the information contained herein is not to be used as an indication for the future performance of any investment activity.
This publication is being furnished to you solely for your information and neither it nor any part of it may be used, forwarded, disclosed, distributed or delivered to anyone else. You may not copy, reproduce, display, modify or create derivative works from any data or information contained in this publication.
Services offered by CFC include products that are traded on margin and can result in losses that exceed deposits. Before deciding to trade on margin products, you should consider your investment objectives, risk tolerance and your level of experience on these products. Trading with leverage carries significant risk of losses and as such margin products are not suitable for every investor and you should ensure that you understand the risks involved and should seek independent advice from professionals or experts if necessary.
هل أنت مستعد للاستثمار؟
استكشف تجربة تداول جديدة مع
تطبيق سنشري تريدر
يمكن أن تتجاوز الخسائر قيمة إيداعاتك
هل أنت مستعد للاستثمار؟
استكشف تجربة تداول جديدة مع
تطبيق سنشري تريدر
يمكن أن تتجاوز الخسائر قيمة ودائعك

تنظمها هيئة الأوراق المالية والسلع
سنشري للاستشارات المالي ش.ذ.م.م


تصل إلينا:
-
دبي
الطابق رقم 6, مبنى رقم 4, ساحة إعمار دبي
وسط مدينة دبي، ص.ب: 65777،
دبي، الإمارات العربية المتحدة -
Abu Dhabi
27th Floor, Office 2701,
Shining Towers, Abu Dhabi, UAE -
Sharjah
29th Floor, Office 2905,
The Business Tower, Sharjah, UAE - +971 (4) 356 2800
- info@century.ae

Century Financial is the presenting sponsor of

ينطوي التداول في المنتجات المالية على مخاطر كبيرة. فالاعتماد على المشتقات المالية المتاحة للتداول خارح البورصة، مثل عقود الفروقات وتداول العملات الأجنبية (الفوركس) الفوري، قد يتسبب في خسائر تتجاوز قيمة الإيداعات الأولية، مما يجعلها غير ملائمة لجميع المستثمرين. فهذه الأدوات المالية المعقدة لا تمنح ملكية مباشرة للأصول الأساسية. لذا، ينبغي للمستثمرين الاحتراز عند تحديد أهدافهم الاستثمارية ومراعاة مستوى المخاطرة المتوقَع، واللجوء إلى الاستشارة المهنية المتخصصة عند الضرورة.
سنشري للإستشارات والتحليل المالي ش.ذ.م.م (الشركة)، شركة مرخّصة ومنظمة من هيئة الأوراق المالية والسلع في دولة الإمارات العربية المتحدة، بموجب الترخيص رقم (20200000028) و(301044) لتولي أعمال الوساطة في الأسواق الدولية، وتداول المشتقات المالية والعملات المتاحة للتداول خارج البورصة في سوق التداول الفوري، بالإضافة إلى تقديم الخدمات الاستشارية والترويجية. تأسست الشركة بموجب قوانين دولة الإمارات العربية المتحدة، وهي مسجلة لدى دائرة التنمية الاقتصادية بدبي (رقم: 768189)، حيث يقع مكتبها المسجّل في 601، الطابق السادس، المبنى رقم 4، ميدان إعمار، وسط مدينة دبي، دولة الإمارات العربية المتحدة، ص.ب. 65777.
لا يُعرَض محتوى هذا الموقع الإلكتروني إلا لأغراض تعريفية تثقيفية بحتة، فلا يمثل عرضًا ولا توصيةً ولا دعوةً لشراء أو بيع أي أوراق مالية أو منتجات مالية.
لا تنوي الشركة استخدام أو توزيع منتجاتها وخدماتها في أي ولاية قضائية حيث يُشكِّل هذا الاستخدام أو التوزيع انتهاكًا للقوانين المحلية أو اللوائح التنظيمية.
