Tuesday, January 31, 2023
All about harmonic price patterns
تم إعداد هذا المنشور من قبل سنشري للاستشارات
.jpg)
Market prices tend to showcase a trend or pattern which is indicative of whether the price will continue in the same direction or if it will reverse. Harmonic price patterns do just that with the added benefit of being more precise. This is because only specific price movements based on Fibonacci retracements and extensions qualify in the formation of a harmonic pattern. This eliminates a substantial degree of subjectivity.
Like all good patterns, harmonic patterns are best traded once they are formed completely.
Trading harmonic patterns require patience, but when applied correctly, they provide wonderful insights into potential future price movements. So let’s learn some of the patterns traders can use to make a successful trade.
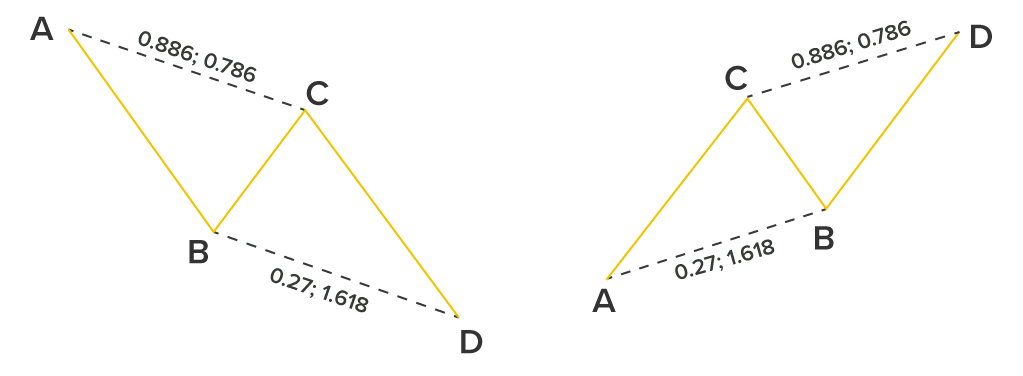
The ABCD Pattern
Deemed by many as the simplest pattern of them all, the ABCD pattern comprises of four points and three movements. The movements include

The pattern’s name derives from the concept that AB = CD. , When the Fibonacci retracement tool is used on the AB leg, the BC leg should touch 0.618 for it to be the same length as AB. The time taken for C to reach D should be equal to the time taken for A to reach B. This allows traders to either choose their point of entry close to C, which is known as Potential Reversal Zone (PRZ) or wait till the pattern completes itself before deciding on a position.
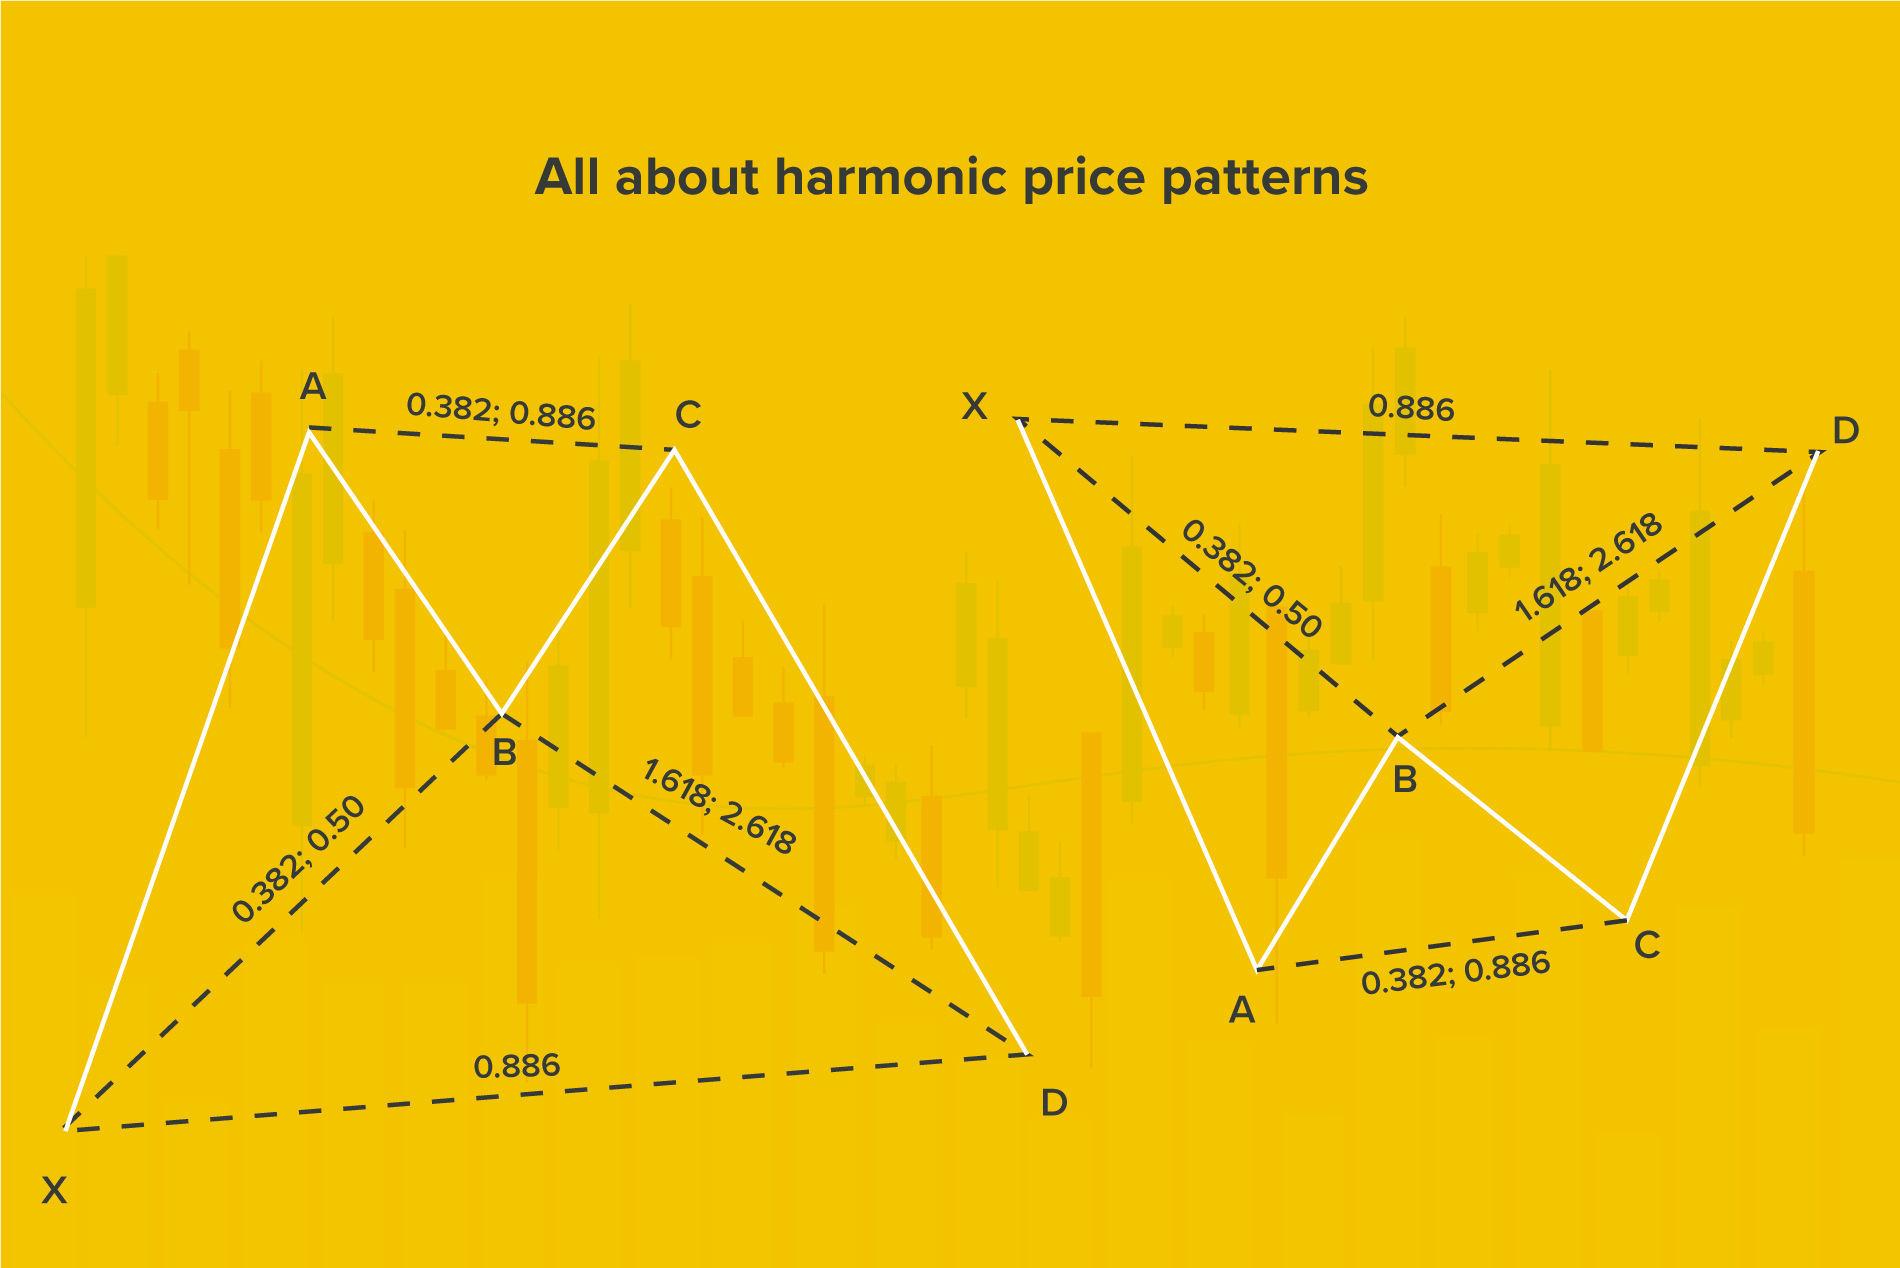
The BAT pattern
First recognized by Scott Carney, this pattern occurs when the trend reverses temporarily, making it a useful tool for scalpers. . Unlike the ABCD pattern, it has an additional leg and point called ‘X’. This pattern appears similar to the Gartley pattern but the ratios are not identical.
The BAT pattern formation is a 5-point retracement structure with a specific Fibonacci measurement for each point. Generally, D entails a zone where the price tends to reverse. When the first leg, XA,moves to a BC retracement, and the retracement stops at 50% of the movement from point B to XA, we see the emergence of the BAT pattern. The CD extension, at the very least, must be 1.618 of the BC leg and should reach 2.618. The figure will be deemed invalid if it is less than the BC. The endpoint (D) will create the PRZ, allowing traders to choose their positions.

The Gartley pattern
Created by Harold McKinley Gartley, the Gartley pattern has similarities to the BAT pattern. It is a simple harmonic pattern that occurs after a substantial low or high, or usually when a correction of the trend is about to happen.
The qualifying factors for a Gartley pattern are:
Remember, when you develop a trading strategy, the stop-loss point is placed at X, and the take-profit is set at C.

The butterfly pattern
Identified by Bryce Gilmore, the butterfly pattern is used to recognize potential retracements through a combination of Fibonacci ratios. As a reversal pattern which often occurs towards the end of a trend, it is comprised of four legs, which are marked as XA, BC, AB, and CD.
For traders that use this pattern, the ratio they need to identify the most is 0.786 retracement of the XA leg. It will help to plot point B, thus assisting traders in recognizing the PRZ.
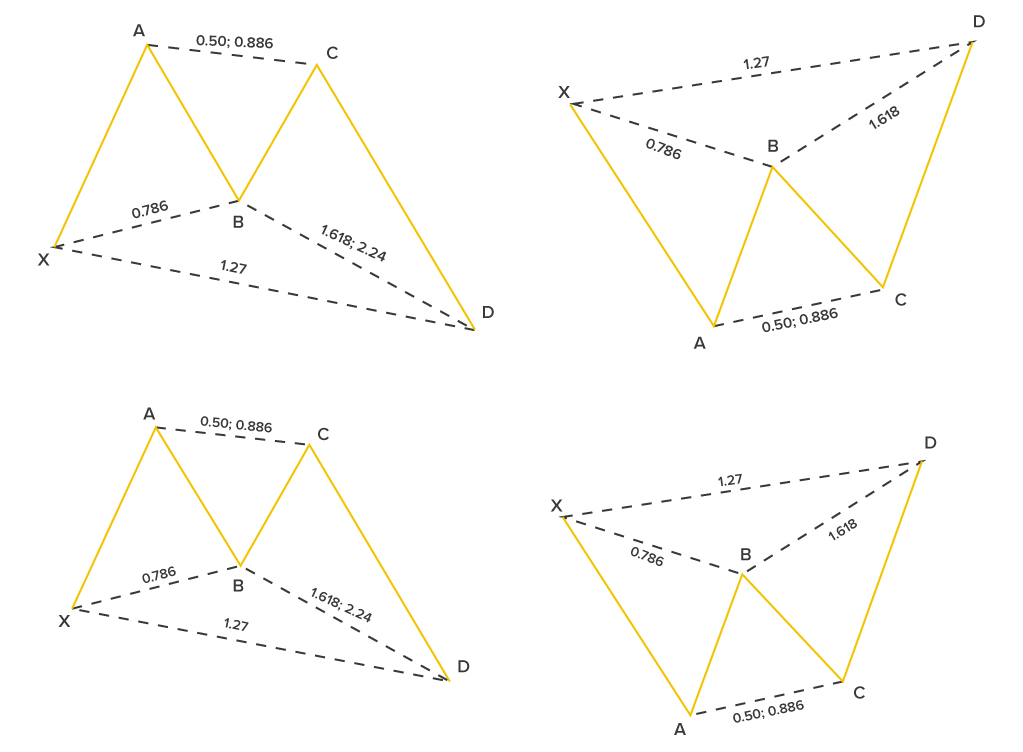

The crab pattern
The crab pattern is meant for traders that seek a trading strategy to enter during extreme highs or lows. It follows a C-D, B-C, A-B and X-A pattern, with its most relevant feature being the 1.618 extensions of the XA movement to identify the PRZ.
In its bullish version, when there is a sharp rise from X to A, the first leg is formed. The AB leg, which retraces between 38.2% and 61.8%, is subsequently followed by an extreme projection of BC to identify the pattern’s completion and the potential reversal of the trend. In the bearish version, it will keep an eye out for a dip from X to A, which is followed by a slight price rise, then a slight decline, and a sharp rise to point D.

Every trader seeks to be successful, and harmonic patterns can help you get there. Moreover, if plotted correctly, these patterns can be a reliable trading tool.
لا تقدم شركة سنشري للإستشارات والتحليل المالي ش.ذ.م.م (الشركة) محتوى هذه المدونة، بما في ذلك أي أبحاث أو تحليلات أو آراء أو توقعات أو أي معلومات أخرى (يُشار إليها مجتمعةً باسم "المعلومات")، إلا لأغراض التسويق والتثقيف وإتاحة المعلومات العامة. ولا يُفسَّر ذلك على أنه نصيحة استثمارية أو توصية أو دعوة لشراء أو بيع أي أدوات مالية.
كما يجوز نشر هذه المعلومات عبر قنوات مختلفة، بما في ذلك موقع الشركة الإلكتروني، ومنصات الغير، والنشرات الإخبارية، والمواد التسويقية، ورسائل البريد الإلكتروني، ووسائل التواصل الاجتماعي، وتطبيقات المراسلة، والندوات الإلكترونية، وغيرها من وسائل التواصل. وبينما تسعى الشركة لضمان دقة المحتوى، فإنها لا تضمن اكتماله أو موثوقيته أو تحديثه في الوقت المناسب. وعليه، فأي قرارات تُتخذ بناءً على هذه المعلومات تكون على مسؤوليتك الشخصية. ولا تتحمل الشركة أي مسؤولية عن أي خسارة أو ضرر ناتج عن استخدامها.
ينطوي تداول المنتجات المالية على مخاطر كبيرة، بما لا يتناسب مع جميع المستثمرين. فيُرجى التأكد من وعيك التام بالمخاطر، وطلب الاستشارة المهنية المتخصصة إذا لزم الأمر.
يُرجى الاطلاع على بيان كشف المخاطر الشامل المتوفر على موقعنا الإلكتروني.


تنظمها هيئة الأوراق المالية والسلع
سنشري للاستشارات المالي ش.ذ.م.م


تصل إلينا:
-
دبي
الطابق رقم 6, مبنى رقم 4, ساحة إعمار دبي
وسط مدينة دبي، ص.ب: 65777،
دبي، الإمارات العربية المتحدة -
Abu Dhabi
27th Floor, Office 2701,
Shining Towers, Abu Dhabi, UAE -
Sharjah
29th Floor, Office 2905,
The Business Tower, Sharjah, UAE - +971 (4) 356 2800
- info@century.ae

Century Financial is the presenting sponsor of

ينطوي التداول في المنتجات المالية على مخاطر كبيرة. فالاعتماد على المشتقات المالية المتاحة للتداول خارح البورصة، مثل عقود الفروقات وتداول العملات الأجنبية (الفوركس) الفوري، قد يتسبب في خسائر تتجاوز قيمة الإيداعات الأولية، مما يجعلها غير ملائمة لجميع المستثمرين. فهذه الأدوات المالية المعقدة لا تمنح ملكية مباشرة للأصول الأساسية. لذا، ينبغي للمستثمرين الاحتراز عند تحديد أهدافهم الاستثمارية ومراعاة مستوى المخاطرة المتوقَع، واللجوء إلى الاستشارة المهنية المتخصصة عند الضرورة.
سنشري للإستشارات والتحليل المالي ش.ذ.م.م (الشركة)، شركة مرخّصة ومنظمة من هيئة الأوراق المالية والسلع في دولة الإمارات العربية المتحدة، بموجب الترخيص رقم (20200000028) و(301044) لتولي أعمال الوساطة في الأسواق الدولية، وتداول المشتقات المالية والعملات المتاحة للتداول خارج البورصة في سوق التداول الفوري، بالإضافة إلى تقديم الخدمات الاستشارية والترويجية. تأسست الشركة بموجب قوانين دولة الإمارات العربية المتحدة، وهي مسجلة لدى دائرة التنمية الاقتصادية بدبي (رقم: 768189)، حيث يقع مكتبها المسجّل في 601، الطابق السادس، المبنى رقم 4، ميدان إعمار، وسط مدينة دبي، دولة الإمارات العربية المتحدة، ص.ب. 65777.
لا يُعرَض محتوى هذا الموقع الإلكتروني إلا لأغراض تعريفية تثقيفية بحتة، فلا يمثل عرضًا ولا توصيةً ولا دعوةً لشراء أو بيع أي أوراق مالية أو منتجات مالية.
لا تنوي الشركة استخدام أو توزيع منتجاتها وخدماتها في أي ولاية قضائية حيث يُشكِّل هذا الاستخدام أو التوزيع انتهاكًا للقوانين المحلية أو اللوائح التنظيمية.
