 Loading ...

Friday, October 16, 2026
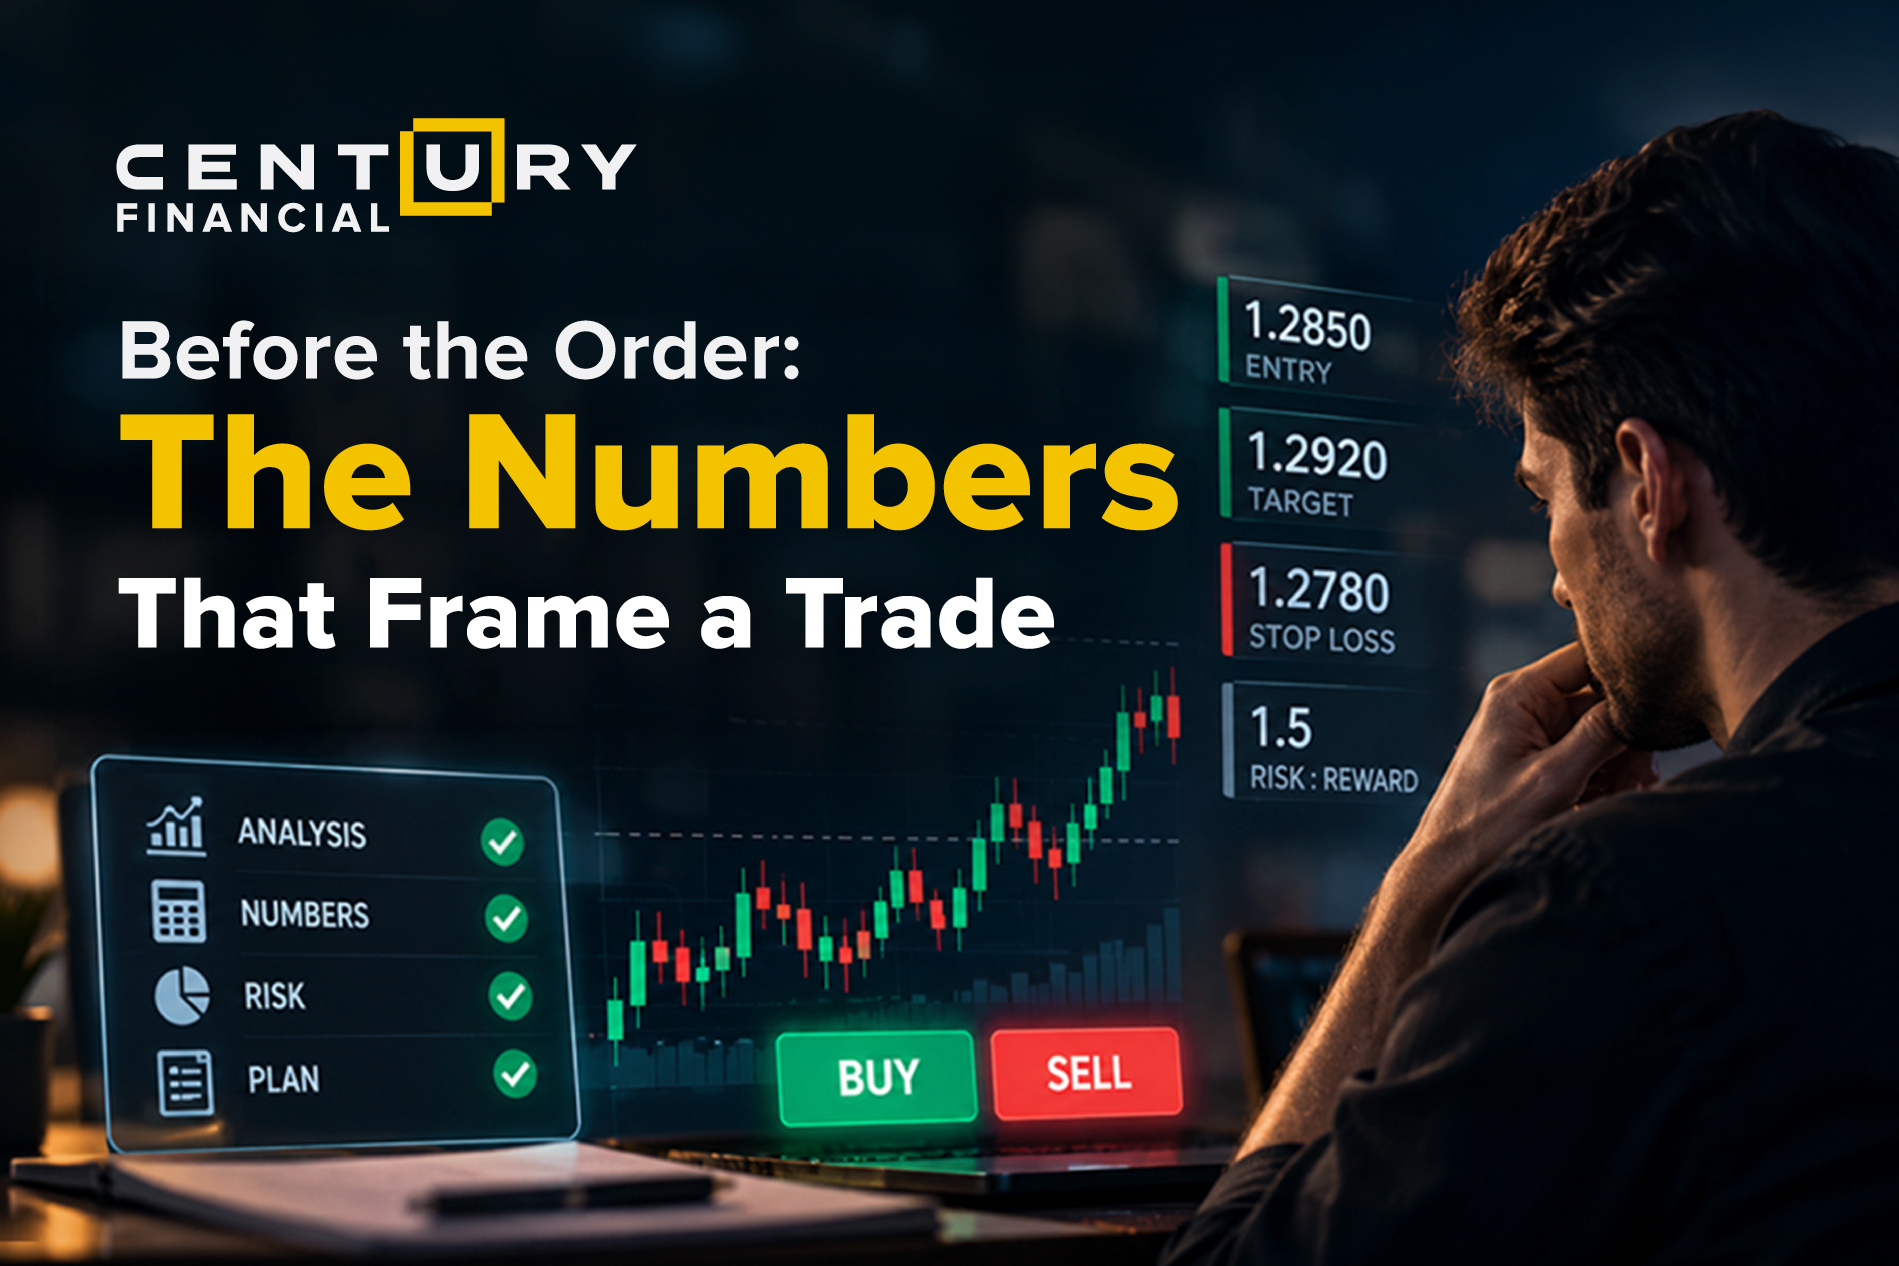
Before the Order: The Numbers That Frame a Trade
تم إعداد هذا المنشور من قبل سنشري للاستشارات
Introduction
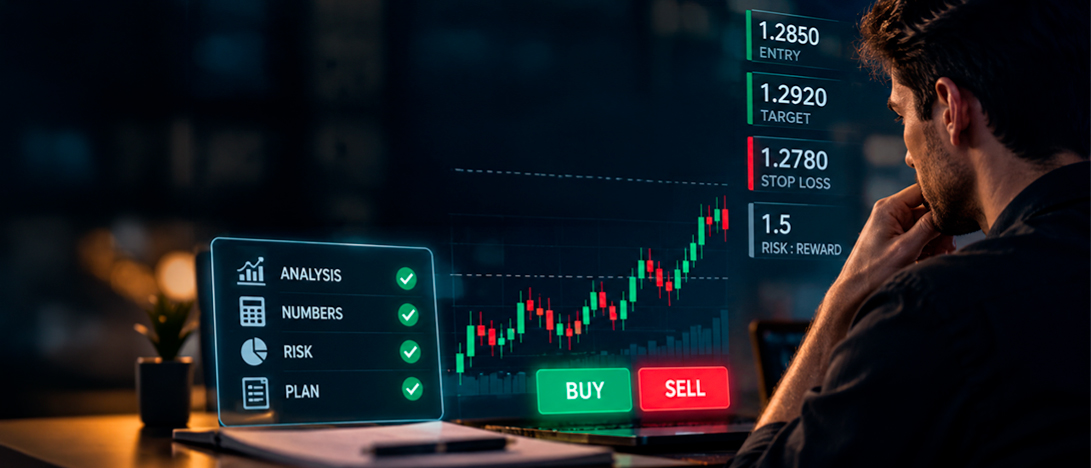
A trade idea is only half the picture. The other half is arithmetic: how much is at risk, what counts as a win after costs, and how much you'd need to gain back if things go the other way.
This piece outlines the core formulas that define a trade before you place it, including how to measure it, size its risk, account for leverage, and view it within a full portfolio.
Why Do Trading Formulas Matter Before a Trade?
Trading formulas turn a vague sense of "this looks good" into a specific, verifiable number. They can help calculate position size, risk percentage, and required win rate before you enter an order, rather than discovering them after the position is already open.
If you skip this step, risk remains undefined until you can no longer adjust it. The math does not predict outcomes, but it does specify the amount at risk on either side.
Formulas for Measuring a Trade
How Is Percentage Return Calculated?
Formula:
Return Percentage = (Exit Price − Entry Price) / Entry Price × 100
This is the baseline measure of how a position performed relative to what was paid for it. A position bought at $50 and sold at $56 returns 12%, and the same position sold at $44 loses 12%.
For a short position, the formula flips to (Entry Price − Exit Price) / Entry Price × 100, since the position gains as price falls rather than rises.
How Do Costs Change Profit or Loss?
Gross return and the return that actually lands in the account rarely match. Here's an example of how that plays out on a single trade; note that the costs mentioned are just figurative:
The difference between $500 and $455 may seem small on a single trade, but it can add up over many trades or a longer holding period. Tracking net figures instead of gross provides a clearer view of actual results.
What Is a Break-Even Price?
Formula:
Break-Even Price = Entry Price + Total Cost per Unit
The break-even price is the level a position must reach to cover its costs before it starts making a real profit. An entry at $50 with a total cost per unit of $0.30 has a break-even price of $50.30. A price between $50 and $50.30 looks like a gain on screen but is still a net loss once you factor in costs.
Why Does Annualized Return Matter?
A 12% return means something very different depending on whether it took two months or two years to earn, and annualizing restates any return yearly so you can compare different holding periods fairly. The formula is:
Return Percentage × (365 / Days Held)
So a 12% return over 60 days annualizes to roughly 73%. Annualizing a very short holding period can exaggerate the result. For example, a strong week or two, when projected over a full year, can produce a headline number that the underlying trade did not actually sustain.
Formulas for Sizing a Trade and Its Risk
What Percentage of the Account Is at Risk?
Risk percentage links the dollar amount at risk on a trade to the total account size using the formula:
(Entry Price − Stop-Loss Price) × Position Size ÷ Account Equity × 100.
For example, on a $10,000 account, a trade that risks $200 if the stop-loss is hit represents 2% of the account. This figure remains comparable across different instruments and price levels. Position sizing keeps this percentage consistent from trade to trade, rather than letting it vary based on confidence in a particular setup.
How Is Position Size Calculated?
Position size is determined by working backward from the chosen risk percentage, rather than starting with a preferred purchase amount. The calculation follows these steps:
If you widen the stop to $46 in step 2, step 3 becomes $4 of risk per unit, reducing the position size to 50 units in step 4 because each unit now carries twice the risk.
What Does a Risk-to-Reward Ratio Show?
A risk-to-reward ratio compares what you risk against what you target if the trade works, using the following formula:
(Target − Entry) / (Entry − Stop-Loss)
A $2 risk against a $6 target produces a 1:3 ratio. But here are the things the ratio does and doesn't tell you:
What Win Rate Does a Ratio Require?
Every risk-to-reward ratio implies a minimum win rate needed to break even over a series of trades, calculated as:
Risk / (Risk + Reward).
| Risk-to-Reward Ratio | Required Win Rate to Break Even |
|---|---|
| 1.1 | 50% |
| 1.2 | 33% |
| 1.3 | 25% |
| 1.4 | 20% |
| 1.5 | 17% |
A strategy with a 1:3 ratio needs to win about 1 in 4 trades to avoid losing money overall, before costs. That is why traders consider both the ratio and the win rate together, not in isolation.
How Does Leverage Change the Math?
Leverage multiplies market exposure relative to the capital committed, so gains and losses scale with the full exposure rather than just the margin put up. The formula is straightforward:
Leveraged Exposure = Margin × Leverage Ratio.
A $1,000 margin deposit at 10:1 leverage controls $10,000 of exposure. For a 5% adverse move, 5% of $10,000 is $500, and that $500 is measured against the original $1,000 margin, not the $10,000 exposure. This results in a 50% reduction in margin.
Leveraged positions can produce losses that exceed the initial deposit, depending on the product and the extent of the market move. For this reason, traders typically size margin and stop-loss levels based on full exposure, not just the margin amount.
Formulas for the Portfolio View
How Is Portfolio Allocation Calculated?
Portfolio allocation shows the percentage of the portfolio each position represents. The formula goes:
Position Value / Total Portfolio Value × 100
A $5,000 position inside a $50,000 portfolio is a 10% allocation on the day it's opened. That percentage does not remain fixed.
If the position grows to $7,500 while the rest of the portfolio stays flat, the allocation increases to about 13% without any new trades, simply because one position grew faster than the others. The reverse occurs when a position underperforms while the rest of the portfolio holds steady. Periodically rechecking allocation helps identify this drift before it alters the portfolio's risk profile.
Why Do Losses Need Larger Gains to Recover?
Percentage losses and the gains needed to recover aren't symmetrical; the formula is:
Required Gain % = Amount Lost ÷ Capital Remaining × 100
| Loss | Gain Needed to Recover |
|---|---|
| 10% | 11% |
| 20% | 25% |
| 30% | 43% |
| 50% | 100% |
| 70% | 233% |
A loss in the 10-20% range requires only a slightly larger gain to recover. This is one reason why capping risk per trade is often considered before a loss can compound into that range. Once a loss exceeds 50%, recovering to break even requires doubling the remaining capital, leaving no margin for error.
This asymmetry is a key reason why risk-per-trade decisions often have greater impact over a long series of trades than any single entry or exit:
A Quick-Reference Sheet of the Core Formulas.
| Metric | Formula | What It Answers |
|---|---|---|
| Percentage return | (Exit − Entry) / Entry × 100 | How much a position gained or lost relative to entry |
| Net profit/loss | Gross P/L − Total Costs | What's actually left after commissions, spreads and fees |
| Break-even price | Entry + Total Cost per Unit | The price needed just to cover costs |
| Annualized return | Return % × (365 / Days Held) | How a return compares across different holding periods |
| Risk percentage | (Entry − Stop) × Position Size / Account Equity × 100 | How much of the account is on the line for this trade |
| Position size | Risk Amount / (Entry − Stop) | How many units to trade for a chosen risk amount |
| Risk-to-reward ratio | (Target − Entry) / (Entry − Stop) | The payoff structure if the trade works |
| Required win rate | Risk / (Risk + Reward) | The minimum win rate needed to break even |
| Leveraged exposure | Margin × Leverage Ratio | The real market exposure behind a margin deposit |
| Portfolio allocation | Position Value / Total Portfolio Value × 100 | What share of capital one position represents |
| Gain needed to recover a loss | Loss % / (1 − Loss %) | How much a loss has to be made back just to break even |
Running the Numbers with Century
Working through this math manually before every trade is not always practical, so having these calculations built into the platform can be more useful than the formulas alone. MT5 and the Century Trader App include position-sizing and margin calculators that process position-size and leverage math in real time, based on account equity and the entered stop-loss level. CQG and TWS extend this to portfolio-level views across multiple positions, which helps identify allocation drift.
These tools don't determine the appropriate risk percentage or position size; the trader still decides. They do, however, remove the manual calculation step where sizing errors can occur.
Elevate your trading
experience with
Century Trader App
Elevate your trading experience
with
Century Trader App

Conclusion
Percentage return, break-even price, position size, risk-to-reward, leverage exposure, and portfolio allocation each address a different aspect of a trade. Together, they define and measure a position before you commit any capital. These formulas don't predict outcomes, but they make position size and potential payoff clear from the outset.
Including this math before placing an order can help traders at any experience level. Century's platforms, including MT5, CQG, TWS, and Century Trader, offer built-in calculators for more complex calculations, while the trader still makes the final risk decisions.

Frequently Asked Questions
Q1: How is profit or loss calculated after trading costs?
A: Net profit or loss equals gross profit or loss minus total costs, including commissions, spreads, financing charges on open positions, and any other fees tied to the trade.
Q2: What is the difference between position size and risk per trade?
A: Risk per trade is the dollar amount or percentage of the account you risk if a stop-loss is hit, while position size is the number of units that produces that risk amount given the gap between entry and stop-loss.
Q3: What does a 1:3 risk-to-reward ratio mean?
A: It means the potential reward is three times the amount being risked; for example, risking $2 to target a $6 gain, which mathematically requires only a 25% win rate to break even before costs.
Q4: Why does a 50% loss require a 100% gain to recover?
A: Because percentage losses and gains aren't symmetrical, once capital drops by 50%, the remaining balance needs to double—a 100% gain—to return to its original value.
Q5: Do trading formulas predict whether a trade will be profitable?
A: No. These formulas measure risk, cost, and position sizing precisely, but they don't forecast whether any individual trade will win or lose; that still depends on how the market actually moves.
لا تقدم شركة سنشري للإستشارات والتحليل المالي ش.ذ.م.م (الشركة) محتوى هذه المدونة، بما في ذلك أي أبحاث أو تحليلات أو آراء أو توقعات أو أي معلومات أخرى (يُشار إليها مجتمعةً باسم "المعلومات")، إلا لأغراض التسويق والتثقيف وإتاحة المعلومات العامة. ولا يُفسَّر ذلك على أنه نصيحة استثمارية أو توصية أو دعوة لشراء أو بيع أي أدوات مالية.
كما يجوز نشر هذه المعلومات عبر قنوات مختلفة، بما في ذلك موقع الشركة الإلكتروني، ومنصات الغير، والنشرات الإخبارية، والمواد التسويقية، ورسائل البريد الإلكتروني، ووسائل التواصل الاجتماعي، وتطبيقات المراسلة، والندوات الإلكترونية، وغيرها من وسائل التواصل. وبينما تسعى الشركة لضمان دقة المحتوى، فإنها لا تضمن اكتماله أو موثوقيته أو تحديثه في الوقت المناسب. وعليه، فأي قرارات تُتخذ بناءً على هذه المعلومات تكون على مسؤوليتك الشخصية. ولا تتحمل الشركة أي مسؤولية عن أي خسارة أو ضرر ناتج عن استخدامها.
ينطوي تداول المنتجات المالية على مخاطر كبيرة، بما لا يتناسب مع جميع المستثمرين. فيُرجى التأكد من وعيك التام بالمخاطر، وطلب الاستشارة المهنية المتخصصة إذا لزم الأمر.
يُرجى الاطلاع على بيان كشف المخاطر الشامل المتوفر على موقعنا الإلكتروني.




تنظمها هيئة الأوراق المالية والسلع
سنشري للاستشارات المالي ش.ذ.م.م


تصل إلينا:
-
دبي
الطابق رقم 6, مبنى رقم 4, ساحة إعمار دبي
وسط مدينة دبي، ص.ب: 65777،
دبي، الإمارات العربية المتحدة -
Abu Dhabi
27th Floor, Office 2701,
Shining Towers, Abu Dhabi, UAE -
Sharjah
29th Floor, Office 2905,
The Business Tower, Sharjah, UAE - +971 (4) 356 2800
- info@century.ae

Century Financial is the presenting sponsor of

ينطوي التداول في المنتجات المالية على مخاطر كبيرة. فالاعتماد على المشتقات المالية المتاحة للتداول خارح البورصة، مثل عقود الفروقات وتداول العملات الأجنبية (الفوركس) الفوري، قد يتسبب في خسائر تتجاوز قيمة الإيداعات الأولية، مما يجعلها غير ملائمة لجميع المستثمرين. فهذه الأدوات المالية المعقدة لا تمنح ملكية مباشرة للأصول الأساسية. لذا، ينبغي للمستثمرين الاحتراز عند تحديد أهدافهم الاستثمارية ومراعاة مستوى المخاطرة المتوقَع، واللجوء إلى الاستشارة المهنية المتخصصة عند الضرورة.
سنشري للإستشارات والتحليل المالي ش.ذ.م.م (الشركة)، شركة مرخّصة ومنظمة من هيئة الأوراق المالية والسلع في دولة الإمارات العربية المتحدة، بموجب الترخيص رقم (20200000028) و(301044) لتولي أعمال الوساطة في الأسواق الدولية، وتداول المشتقات المالية والعملات المتاحة للتداول خارج البورصة في سوق التداول الفوري، بالإضافة إلى تقديم الخدمات الاستشارية والترويجية. تأسست الشركة بموجب قوانين دولة الإمارات العربية المتحدة، وهي مسجلة لدى دائرة التنمية الاقتصادية بدبي (رقم: 768189)، حيث يقع مكتبها المسجّل في 601، الطابق السادس، المبنى رقم 4، ميدان إعمار، وسط مدينة دبي، دولة الإمارات العربية المتحدة، ص.ب. 65777.
لا يُعرَض محتوى هذا الموقع الإلكتروني إلا لأغراض تعريفية تثقيفية بحتة، فلا يمثل عرضًا ولا توصيةً ولا دعوةً لشراء أو بيع أي أوراق مالية أو منتجات مالية.
لا تنوي الشركة استخدام أو توزيع منتجاتها وخدماتها في أي ولاية قضائية حيث يُشكِّل هذا الاستخدام أو التوزيع انتهاكًا للقوانين المحلية أو اللوائح التنظيمية.
