Understanding support and resistance levels is one of the most essential skills in technical analysis. Let’s break it down.
Support and resistance are like the building blocks of technical analysis. Prices in the market are constantly moving due to the forces of supply and demand, and these levels show where those forces balance out.
What is Support?
Think of support as a safety net on a price chart. It’s a level or zone below the current market price where there’s enough buying interest to stop a price drop and possibly push prices back up. In other words, it’s where buyers step in and say, "We’re not letting the price fall any further."
When looking at a trendline, the low points, or troughs, represent support levels. Recognizing these levels is a key skill in technical analysis, as they can indicate where the price might bounce back up.
What is Resistance?
Resistance is the flip side of support. It’s a level or zone above the current market price where selling pressure might overpower buying pressure, causing the price to reverse direction and move downward. It’s like a ceiling that the price struggles to break through.
It’s important to remember that just because the price has hit a previous high doesn’t mean it will stop there again with pinpoint accuracy. However, you can generally expect some resistance around that area.
The uptrend and downtrend in support and resistance is shown in figure 2.1 and figure 2.2 respectively.

Practical Tips for Identifying Support and Resistance
Identifying support and resistance levels means figuring out which key prices are shaping the trend or range and why they stand out compared to other prices. There are some helpful tips and guidelines to determine how legitimate and strong a price level is, whether it’s support or resistance:
- Times Tested: If a price level has been "tested" (meaning the market has hit or come close to it) several times, it often sticks in the minds of traders. For instance, traders might hesitate to sell when the price nears a previous low if past experience suggests it’s a bad idea.
- Volume at the Level: Building on the first point, when a significant amount of trading volume has occurred at or near a certain level, it tends to catch the attention of market participants.
- Recent Activity: The more recent the trading activity at a specific level, the more relevant that level becomes in analysing current market prices.
- Round Numbers: There’s a psychological aspect to trading where round numbers (like 50, 100, 1000) tend to stand out. Traders often remember these numbers, which can influence their decisions.
This can be seen in figure 2.3

Trading Strategies Using Support and Resistance
Support and resistance levels are powerful tools for deciding when to enter or exit trades, especially when combined with smart risk management. Here are some practical ways to use them:
- Taking Profits: This is the price where you decide to lock in gains on a trade. For example, if the price is nearing a support level from above, short sellers might choose to take their profits. On the flip side, when the price approaches a resistance level from below, long traders may decide to cash out.
- Entering a New Position Near an Unbroken Level: When the price is approaching a support level, a trader focused on technical analysis might place limit buy orders just above that support. Similarly, they might place limit sell orders near and slightly below resistance levels.
- Entering a New Position After a Level Breaks: If a support level breaks, it can be a signal to open a short position, expecting the price to drop to the next lower support level. Conversely, if a resistance level is breached, it could be an opportunity to buy, anticipating the price to rise to the next higher resistance level—if one exists.
- Setting a Stop-Loss: You can also use the break of a support or resistance level to limit your losses. Instead of seeing a breach as a chance to open a new position, it can be a cue to exit a losing trade immediately. The breach of a support or resistance level serves as a clear signal to cut your losses.
Once broken, support and resistance levels reverse roles. This is a key aspect of support and resistance identification: once a level (whether support or resistance) is broken, the technical characteristic of the level is reversed. That is, a broken support now becomes a resistance and a broken resistance now becomes a support. This can be seen in figure 2.4.

Technical analysis in ranges
One of the most useful technical patterns is a sideways trend, or range. It allows a simple, mechanical strategy to be followed as detailed below.

Getting Started with Support and Resistance Trading
The first step in trading with support and resistance is to identify the levels that are currently influencing the market’s price movements. Once you’ve pinpointed these key areas, the idea is to strategically place your buy orders just above the support level and your sell orders slightly below the resistance level. It’s also a good practice to set stop-loss orders to protect yourself in case the market moves against your trade.
An example:
A basic example of a trade plan, with a planned limited risk (for instance the difference between our orders and the exit), for a hoped-for return. There are two possible scenarios that may follow on from this plan:
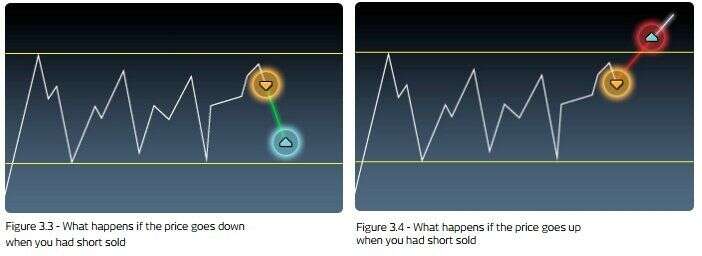
If the trade plan outlined in figure 3.2 is used and a sell position is entered into, one of two events will occur. They are outlined in figures 3.3 and 3.4. Figure 3.3 shows the ideal scenario. A short (sell) position was entered into at the top of the range, near the high and resistance level, with a stop loss on the other side of resistance.
From the selling point, the price falls back to the lower end of the range and the take profit order (near support) is triggered and the position is exited with a profit.
Figure 3.4 shows the scenario to avoid, but that you must be prepared for. A short (sell) position was entered at the top of the range, near the high and resistance level, with a stop loss on the other side of resistance. From the selling point, the price rises back to, and through, the upper end of the range, instead of falling. In doing so, it hits and triggers the stop loss. This position is therefore exited with a loss. Note: please be aware that this is a very basic outline of a possible trading plan. You should never stop learning and practicing in this area.
- This is a theoretical example of a trade plan, driven by identification of support and resistance
- The application of buy and sell orders based on point 1
- The application of stop loss measures to limit risk and safeguard performance. Below, the schematic method shown in figures 3.3 and 3.4 has been applied to a practical (but historic) trading plan and market
Planning Your Trade: A Practical Example
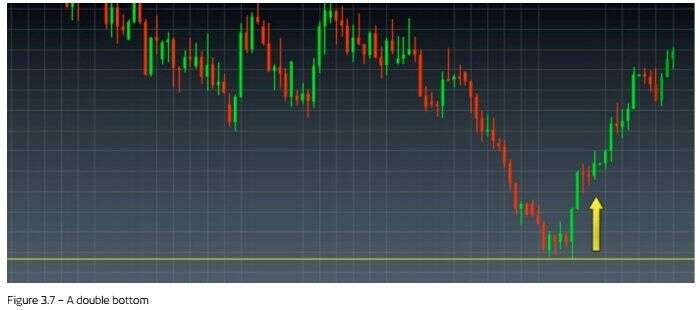
Let’s walk through a practical scenario. Imagine that a support level has been broken, causing the price to drop significantly. After some time, the price starts to recover and approaches the old support level, which has now turned into a resistance level.

At this point, you have two strategies to consider:
- Short Selling: You could place a short sell order just below the resistance level, with a stop-loss set just above it. This approach anticipates that the price will drop again.
- Waiting for a Breakout: Alternatively, you might wait to see if the price breaks through the resistance. If it does, you could place a buy order just above the breakout, with a stop-loss slightly below the old resistance, which should now act as a new support level.
Key Patterns to Watch For:
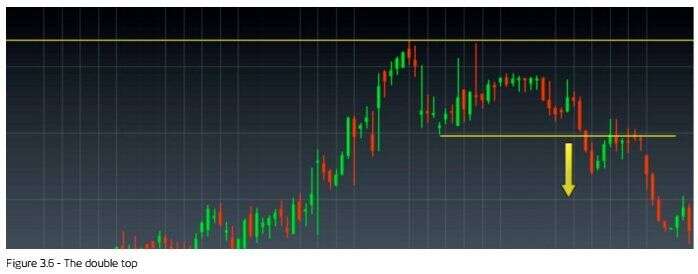
One pattern to be aware of is the Double Top (as shown in figure 3.6). This occurs when the price tests a resistance level twice, then falls back down to the support level and eventually breaks through it. The specific name of the pattern isn’t as important as recognizing that a significant level, such as support, has been breached.
If there are three distinct tests of the resistance level followed by a drop that breaks through the support, this pattern is called a Triple Top.
A pattern is only confirmed once the support or resistance levels are broken. Until then, it remains a potential pattern that might or might not play out.
Disclaimer: Century Financial Consultancy LLC (“CFC”) is Limited Liability Company incorporated under the Laws of UAE and is duly licensed and regulated by the Emirates Securities and Commodities Authority of UAE (SCA). This document is a marketing material and is for informational purposes only and must not be construed to be an advice to invest or otherwise in any investment or financial product. CFC does not guarantee as to adequacy, accuracy, completeness or reliability of any information or data contained herein and under no circumstances whatsoever none of such information or data be construed as an advice or trading strategy or recommendation to deal (Buy/Sell) in any investment or financial product. CFC is not responsible or liable for any result, gain or loss, based on this information, in whole or in part.
PLEASE READ THE FOLLOWING TERMS AND CONDITIONS OF ACCESS FOR THE PUBLICATION BEFORE THE USE THEREOF.
By use of the publication and continuing to access the publication, you accept these terms and conditions and undertake to be bound by the acceptance. CFC reserves the right to amend, remove, or add to the publication and Disclaimer at any time without any prior notice to you. Such modifications shall be effective immediately. Accordingly, please continue to review this Disclaimer whenever accessing, or using the publication. Your access of, and use of the publication, after modifications to the Disclaimer will constitute your acceptance of the terms and conditions of use of the publication, as modified. If, at any time, you do not wish to accept the content of this Disclaimer, you may not access, or use the publication. Any terms and conditions proposed by you which are in addition to or which conflict with this Disclaimer are expressly rejected by CFC and shall be of no force or effect.
No information as given herein by CFC in this publication should be construed as an offer, recommendation or solicitation to purchase or dispose of any securities/financial instruments/products or to enter in any transaction or adopt any hedging, trading or investment strategy. Neither this publication nor anything contained herein shall form the basis of any contract or commitment whatsoever. Distribution of this publication does not oblige CFC to enter into any transaction.
The content of this publication should not be considered legal, regulatory, credit, tax or accounting advice. Anyone proposing to rely on or use the information contained in the publication should independently verify and check the accuracy, completeness, reliability and suitability of the information and should obtain independent and specific advice from appropriate professionals or experts regarding information contained in this publication. CFC cannot be held responsible for the impact of any transactional costs or any taxes as may be applicable on transactions.
Information contained herein is based on various sources, including but not limited to public information, annual reports and statistical data that CFC considers reliable. However, CFC makes no representation or warranty as to the accuracy or completeness of any report or statistical data made in or in connection with this publication and accepts no responsibility whatsoever for any loss or damage caused by any act or omission taken as a result of the information contained in this publication. The articles does not take into account the investment objectives, financial situations and specific needs of recipients. The recipient of this publication must make its own independent decisions regarding whether this communication and any securities or financial instruments mentioned herein, is appropriate in the light of its existing portfolio holdings and/or investment needs.
This document is a marketing material and has been prepared by individual(s), marketing and/or research personnel of CFC. It has not been prepared in accordance with legal requirements designed to promote the independence of investment research and as such is purely a marketing communication. In this publication, any opinions, news, research, analysis, prices, or other information constitute is a general market commentary, and do not constitute the opinion or advice of CFC or any form of personal or investment advice. CFC neither endorses nor guarantees offerings of third party, nor is CFC responsible for the content, veracity or opinions of third-party speakers, presenters, participants or providers. CFC will not accept liability for any loss or damage, including without limitation to, any loss of profit, which may arise directly or indirectly from use of or reliance on such information.
Charts, graphs and related data or information provided in this publication are intended to serve for illustrative purposes only. The information contained in this publication is prepared as of a particular date and time and will not reflect subsequent changes in the market or changes in any other factors relevant to their determination. All statements as to future matters are not guaranteed to be accurate. CFC expressly disclaims any obligation to update or revise any forward-looking statements to reflect new information, events or circumstances after the date of this publication or to reflect the occurrence of unanticipated events.
Staff members/employees of CFC may provide/present oral or written market commentary or analysis to you that reflect opinions that are contrary to the opinions expressed in this research and may contain insights and reports that are inconsistent with the views expressed in this publication. Neither CFC nor any of its affiliates, group companies, directors, employees, agents or representatives assume any liability nor shall they be made liable for any damages whether direct, indirect, special or consequential including loss of revenue or profits that may arise from or in connection with the use of the information provided in this publication.
Information or data provided by means in this publication may have many inherent limitations, like module errors or lack accuracy in its historical data. Data included in the publication may rely on models that do not reflect or take into account all potentially significant factors such as market risk, liquidity risk, credit risk etc.
The use of our information, products and services should be on your own due diligence and you agree that CFC is not liable for any failure to achieve desired return on investment that is in any manner related to availing of services or products of CFC and use of our information, products and services. You acknowledge and agree that past investment performance is not indicative of the future performance results of any investment and that the information contained herein is not to be used as an indication for the future performance of any investment activity.
This publication is being furnished to you solely for your information and neither it nor any part of it may be used, forwarded, disclosed, distributed or delivered to anyone else. You may not copy, reproduce, display, modify or create derivative works from any data or information contained in this publication.
Services offered by CFC include products that are traded on margin and can result in losses that exceed deposits. Before deciding to trade on margin products, you should consider your investment objectives, risk tolerance and your level of experience on these products. Trading with leverage carries significant risk of losses and as such margin products are not suitable for every investor and you should ensure that you understand the risks involved and should seek independent advice from professionals or experts if necessary.
هل أنت مستعد للاستثمار؟
استكشف تجربة تداول جديدة مع
تطبيق سنشري تريدر
يمكن أن تتجاوز الخسائر قيمة إيداعاتك
هل أنت مستعد للاستثمار؟
استكشف تجربة تداول جديدة مع
تطبيق سنشري تريدر
يمكن أن تتجاوز الخسائر قيمة ودائعك

تنظمها هيئة الأوراق المالية والسلع
سنشري للاستشارات المالي ش.ذ.م.م


تصل إلينا:
-
دبي
الطابق رقم 6, مبنى رقم 4, ساحة إعمار دبي
وسط مدينة دبي، ص.ب: 65777،
دبي، الإمارات العربية المتحدة -
Abu Dhabi
27th Floor, Office 2701,
Shining Towers, Abu Dhabi, UAE -
Sharjah
29th Floor, Office 2905,
The Business Tower, Sharjah, UAE - +971 (4) 356 2800
- info@century.ae

Century Financial is the presenting sponsor of

ينطوي التداول في المنتجات المالية على مخاطر كبيرة. فالاعتماد على المشتقات المالية المتاحة للتداول خارح البورصة، مثل عقود الفروقات وتداول العملات الأجنبية (الفوركس) الفوري، قد يتسبب في خسائر تتجاوز قيمة الإيداعات الأولية، مما يجعلها غير ملائمة لجميع المستثمرين. فهذه الأدوات المالية المعقدة لا تمنح ملكية مباشرة للأصول الأساسية. لذا، ينبغي للمستثمرين الاحتراز عند تحديد أهدافهم الاستثمارية ومراعاة مستوى المخاطرة المتوقَع، واللجوء إلى الاستشارة المهنية المتخصصة عند الضرورة.
سنشري للإستشارات والتحليل المالي ش.ذ.م.م (الشركة)، شركة مرخّصة ومنظمة من هيئة الأوراق المالية والسلع في دولة الإمارات العربية المتحدة، بموجب الترخيص رقم (20200000028) و(301044) لتولي أعمال الوساطة في الأسواق الدولية، وتداول المشتقات المالية والعملات المتاحة للتداول خارج البورصة في سوق التداول الفوري، بالإضافة إلى تقديم الخدمات الاستشارية والترويجية. تأسست الشركة بموجب قوانين دولة الإمارات العربية المتحدة، وهي مسجلة لدى دائرة التنمية الاقتصادية بدبي (رقم: 768189)، حيث يقع مكتبها المسجّل في 601، الطابق السادس، المبنى رقم 4، ميدان إعمار، وسط مدينة دبي، دولة الإمارات العربية المتحدة، ص.ب. 65777.
لا يُعرَض محتوى هذا الموقع الإلكتروني إلا لأغراض تعريفية تثقيفية بحتة، فلا يمثل عرضًا ولا توصيةً ولا دعوةً لشراء أو بيع أي أوراق مالية أو منتجات مالية.
لا تنوي الشركة استخدام أو توزيع منتجاتها وخدماتها في أي ولاية قضائية حيث يُشكِّل هذا الاستخدام أو التوزيع انتهاكًا للقوانين المحلية أو اللوائح التنظيمية.
