In a blooming daisy, in a ripe pineapple, in a cluster of honey bees, in the branches of a tree – do you know what you will find common in all these things? No, it is not the beauty of nature that we are referring to. Anything else?
It’s the Fibonacci’s Golden Ratio. Even though ancient Indian mathematical geniuses had discovered the Golden Ratio decades ago, the concept is most famously associated with Leonardo Fibonacci a.k.a. Leonardo of Pisa, as he was the one to popularize the numerical marvel amongst the westerner European mathematicians.
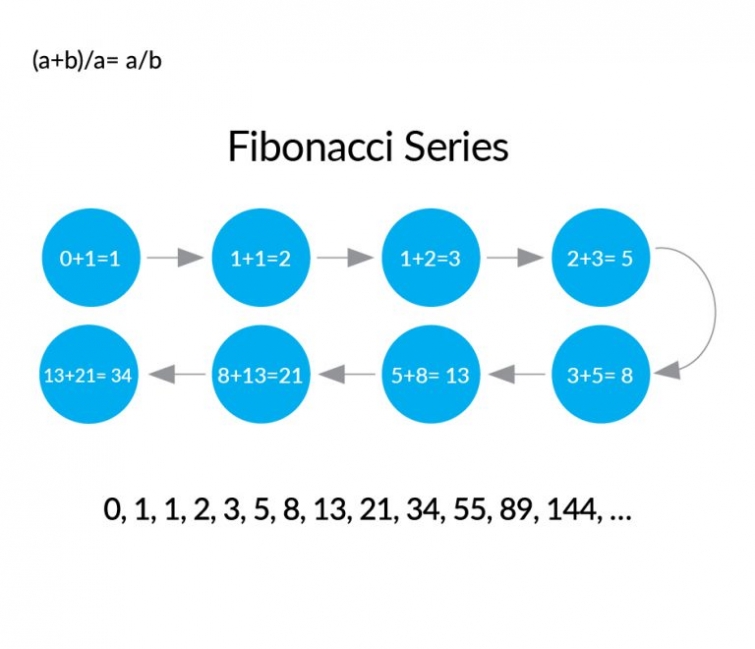
To strip it down to the basics, the Fibonacci series is basically a cumulative progression of the previous two numbers. The modern version begins with 0 and 1 and progresses as shown in the diagram. But it doesn’t end there. As we progress further into the series, dividing any number with its previous number, gives us the Golden Ratio. The number is 1.618033989, abbreviated as 1.618 (or in inverse 1.618) and the further you go into the series, the closer you get to the golden ratio. Try it for yourself! Say 55 and 89 – 1.618. Mathematically, the ratio is obtained by the following statement:
(a+b)/a= a/b
Not only that, the Golden Ratio has been even incorporated in the ages-old architecture and paintings. Michelangelo’s ‘The Creation of Adam’ on the Sistine Chapel, Leonardo Da Vinci’s ‘Vitruvian Man’ to say for art, and the Pyramid of Giza (falling short of the golden ratio by just 7”) to the proportion of the Taj Mahal, everything that has ever pleased the human eye, has been constructed on the basis of the Golden Ratio. It shouldn’t come as a surprise now if we tell you this ratio is also referred to as the ‘Divine Ratio’.
The utility of this universal number is wide. Its attributes are largely used even in stock markets technical analysis. A typical Fibonacci retracement comprises of a few definite number:
- 0.618 – obtained by dividing a number with the previous number in the series
- 0.382 – obtained by dividing alternative (skipping one in between) number in the Fibonacci series
- 0.236 – obtained by dividing a number by another number three places higher in the series.
- 1.618 – obtained as an inverse to 0.618
- 2.618 – obtained as an inverse to 0.382
The first three ratios are used to define good support and resistance lines. The last two ratios are called the extensions or profit taking levels. They are used to define the extent to which the prices can move followed by a trend reversal. There are also the 0.50 and1.00 levels of retracement which don’t stem from the Fibonacci series but find roots in the Dow’s theory that says averages often retrace half their previous movement.
Since the time Fibonacci’s application in technical analysis became kn
own, people have developed lots of various Fibonacci usages. For instance, there is Fibonacci Time Zones. It is a series of lines spaced at Fibonacci intervals of 1, 2, 3, 5, 8, 13, and 21 and so on. These lines form the alert zones which project regions of possible price movements. A base time interval ranging anywhere from 1 hour to 1 day is chosen and then the Fibonacci Time Zone are traced on it. The Fibonacci number is the value of how much the base interval is incremented to forecast a future time.
Similarly, we have Fibonacci Fan, Fibonacci Spiral, Fibonacci Arc and Fibonacci Channel amongst others. This pretty much says Fibonacci can be applied in any desired way of perception. That’s the greatness of the Divine Ratio.
Also, Fibonacci retracement is used extensively in Simple Harmonics. More than one, usually three, retracement is drawn to specifications in order to identify definite patterns. And these patterns are in turn used to indicate trend reversals. Commonly used patterns are those of Bat, Butterfly, Crab, Gartley and Shark. Each has its own set of ratios to consider, but their application is wide in the modern trading culture.
The fact that the Golden Ratio and Fibonacci series would find a fit within the dynamics of an even stock market just shows how universal this really is. From understanding the historical movement to predicting possible future outcomes, the Golden Ratio does it all.


