Thursday, February 16, 2023
Pair Trade Analysis- Nasdaq-100 & South Africa-40
تم إعداد هذا المنشور من قبل سنشري للاستشارات

*Trading in financial market carries risk and can result in loss of capital.
*This performance is only observed with historical backtests and not traded by the company.
The product and investment ideas do not consider the risk profile and financial position of the recipient and may not be suitable for everyone. Trading in financial markets and use of margin involves a significant risk of loss, which can exceed deposits. Please read the complete disclaimer carefully.
إخلاء المسؤولية

الإستراتيجية المنطقية
الفكرة الأساسية وراء الاستراتيجية هي أن أسهم شركات التكنولوجيا الأمريكية العريقة تميل إلى التفوق في الأداء على شركات جنوب أفريقيا على المدى الطويل.
تتطلب هذه الإستراتيجية أن يقوم المستثمر المتمرس بالبيع على مؤشر South Africa 40، وفي نفس الوقت يقوم بالشراء على مؤشر tech-heavy Index – Nasdaq 100. من خلال القيام بذلك ، من المرجح أن يحصل المستثمر على تكلفة احتفاظ تقارب 6.15٪ سنويًا تطبق حاليًا على مؤشر South Africa 40. بينما من ناحية أخرى ، سيتعين على الشخص دفع تكلفة احتفاظ تقارب 6.05٪ سنويًا ، وهي قابلة للتطبيق حاليًا على مؤشر Nasdaq 100. على أساس صافي ، يمكن أن يحصل المستثمرون على تكاليف احتفاظ تبلغ حوالي 0.10٪ سنويًا. (برافعة مالية مضاعفة).
تم اشتقاق الأرقام الواردة في الجدول من خلال الدخول في صفقات شراء في مؤشر US Nasdaq 100 ، وفي الوقت نفسه صفقات بيع في مؤشر South Africa 40 مع تعرض متساوٍ على كلا الجانبين.
على مدى السنوات الـ 16 الماضية ، مع رافعة مالية بخمس مرات ، كان من الممكن أن تحقق هذه الإستراتيجية ربحًا إجماليًا يقارب 445٪ (المتوسط التقديري - 11.11٪ سنويًا) بنسبة إصابة تبلغ 81.25٪. كما هو موضح في الجدول ، باستثناء ثلاث سنوات (2008 و 2012 و 2022) ، فقد تفوق مؤشر US Nasdaq 100 على South Africa 40 في كل عام.
حتى الآن هذا العام ، تفوق مؤشر Nasdaq 100 على مؤشر South Africa 40 مما أدى إلى مكاسب بنسبة 6٪ تقريبًا برافعة مالية مضاعفة.
| Year | Nasdaq yearly return |
S. Africa 40 yearly return |
Long: NDAQ Short: SA40 (Return) |
Net holding cost received |
Total return |
Return post exposure of $250K on each investment |
Profits/Losses each year on $100,000 investment |
| 2x lev | 2x lev | 2x lev | 5x lev | ||||
| 2023 YTD | 16% | 10% | 6% | 0.1% | 6.04% | 15% | $15,100 |
| 2022 | -33% | 1% | -34% | 0.2% | -33.74% | -84% | -$84,350 |
| 2021 | 27% | 23% | 3% | 4.9% | 8.2% | 21% | $20,561 |
| 2020 | 48% | 7% | 41% | 1.8% | 42.4% | 106% | $105,914 |
| 2019 | 38% | 9% | 29% | 4.2% | 33.1% | 83% | $82,785 |
| 2018 | -1.60% | -11% | 9% | 3.4% | 12.9% | 32% | $32,236 |
| 2017 | 31% | 20% | 11% | 4.3% | 15.2% | 38% | $37,936 |
| 2016 | 8% | -4% | 13% | 5.0% | 17.6% | 44% | $43,887 |
| 2015 | 8% | 4% | 4% | 4.8% | 8.5% | 21% | $21,180 |
| 2014 | 18% | 6% | 12% | 4.8% | 17.3% | 43% | $43,305 |
| 2013 | 32% | 19% | 12% | 4.2% | 16.6% | 42% | $41,609 |
| 2012 | 15% | 22% | -8% | 3.9% | -3.8% | -9% | -$9,414 |
| 2011 | 2% | -1% | 2% | 4.1% | 6.4% | 16% | $16,119 |
| 2010 | 18% | 15% | 3% | 4.5% | 7.7% | 19% | $19,208 |
| 2009 | 53% | 29% | 25% | 5.7% | 30.6% | 76% | $76,450 |
| 2008 | -42% | -26% | -16% | 8.9% | -7.2% | -18% | -$18,124 |
| Estimated Total | 178% | 445% | $444,402 | ||||
| Average Estimated Return |
178% | ||||||
Data Source: Bloomberg
Date: 08/02/2023
التحليل الأساسي
كان العام الماضي مليئًا بالتحديات لكل من السندات والأسهم. تسببت الحرب الروسية الأوكرانية في ارتفاع التضخم إلى أكثر من 9٪ بحلول يونيو 2022 ، مما أدى إلى ارتفاع أسعار معظم السلع وأثر بشكل مباشر على الأسواق المالية. ونتيجة لذلك ، واجه الاقتصاد الأمريكي زيادات لا هوادة فيها في أسعار الفائدة من جانب الاحتياطي الفيدرالي للسيطرة على التضخم. أثر الارتفاع السريع في سعر الفائدة القياسي على مؤشر tech heavy Nasdaq بشكل كبير. وخسر المؤشر 33٪ من قيمته خلال العام. شهدت أكبر ثماني شركات فيها انخفاضًا بنسبة 50٪ أو أكثر في أسعار الأسهم.
وفي الوقت نفسه ، شهدت جنوب إفريقيا عامًا أفضل ، حيث يعتمد اقتصادها بشكل أساسي على الصادرات السلعية ، مما يدعم سوقها المالي. على ما يبدو في "سنوات الأزمة" ، 2008 ، 2012 و 2022 ، تقوق South Africa 40 في الأداء على مؤشر Nasdaq. ومع ذلك ، فإن ما حدث في عام 2022 ، قد يكون أكثر من مجرد حادث غريب مع تراجع كل من السندات والأسهم خلال العام.
بالنظر إلى المستقبل ، فإن إعادة فتح الصين والاستراتيجية العادية التي اعتمدتها شركات التكنولوجيا لتقليل تكاليف التشغيل يمكن أن تساعد في عودة مؤشر Nasdaq إلى طبيعته خلال عام 2023. وقد انخفض معدل التضخم إلى 6.5٪ ، لذلك من المرجح أن تتحرك زيادات أسعار الفائدة بوتيرة أبطأ ستكون إيجابية للمؤشر التكنولوجي.
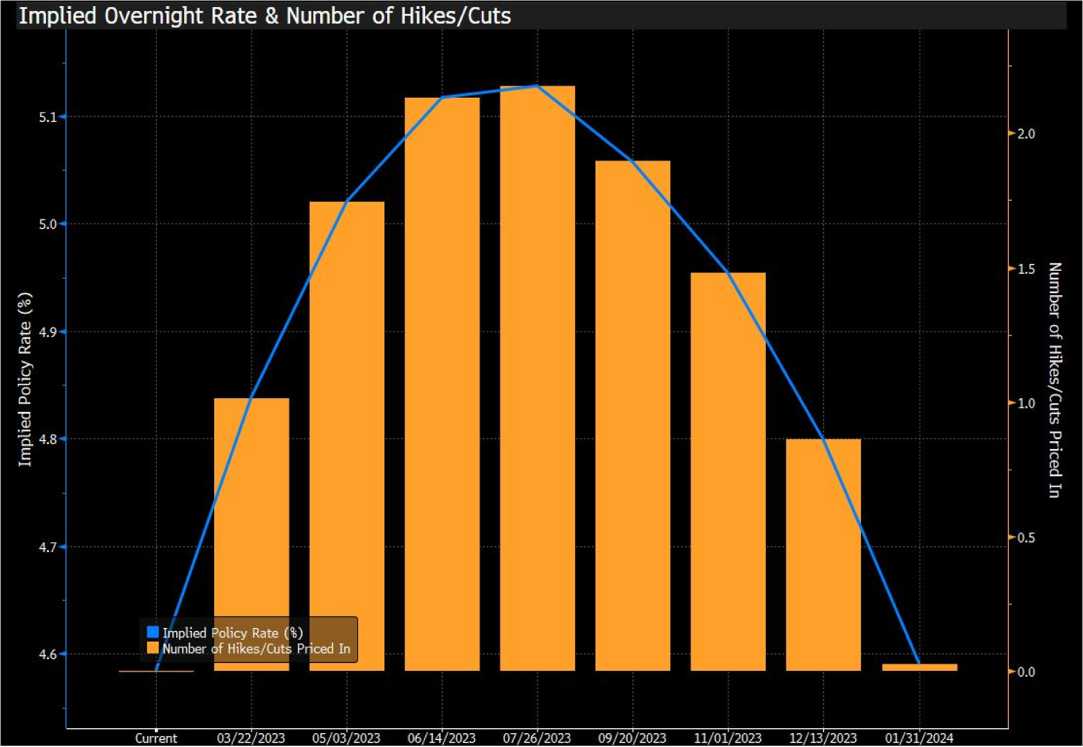
يتوقع المحللون أن معدل الفائدة المستهدف من بنك الاحتياطي الفيدرالي ، والذي يتأرجح حاليًا بين 4.5٪ و 4.75٪ ، قد يصل إلى الذروة عند 5.132٪ بحلول يوليو. بعبارة أخرى ، المحرك الأساسي للاندفاع التكنولوجي هو أن ذروة سعر الفائدة قريبة.
مسار سعر الفائدة
Data Source: Bloomberg
Date: 08/02/2023
يتوقع المحللون أنه بعد بلوغ الذروة بالقرب من 5.132٪ ، يمكن لمجلس الاحتياطي الفيدرالي إجراء تخفيضين لسعر الفائدة بمقدار 25 نقطة أساس لكل منهما بحلول نهاية عام 2023.
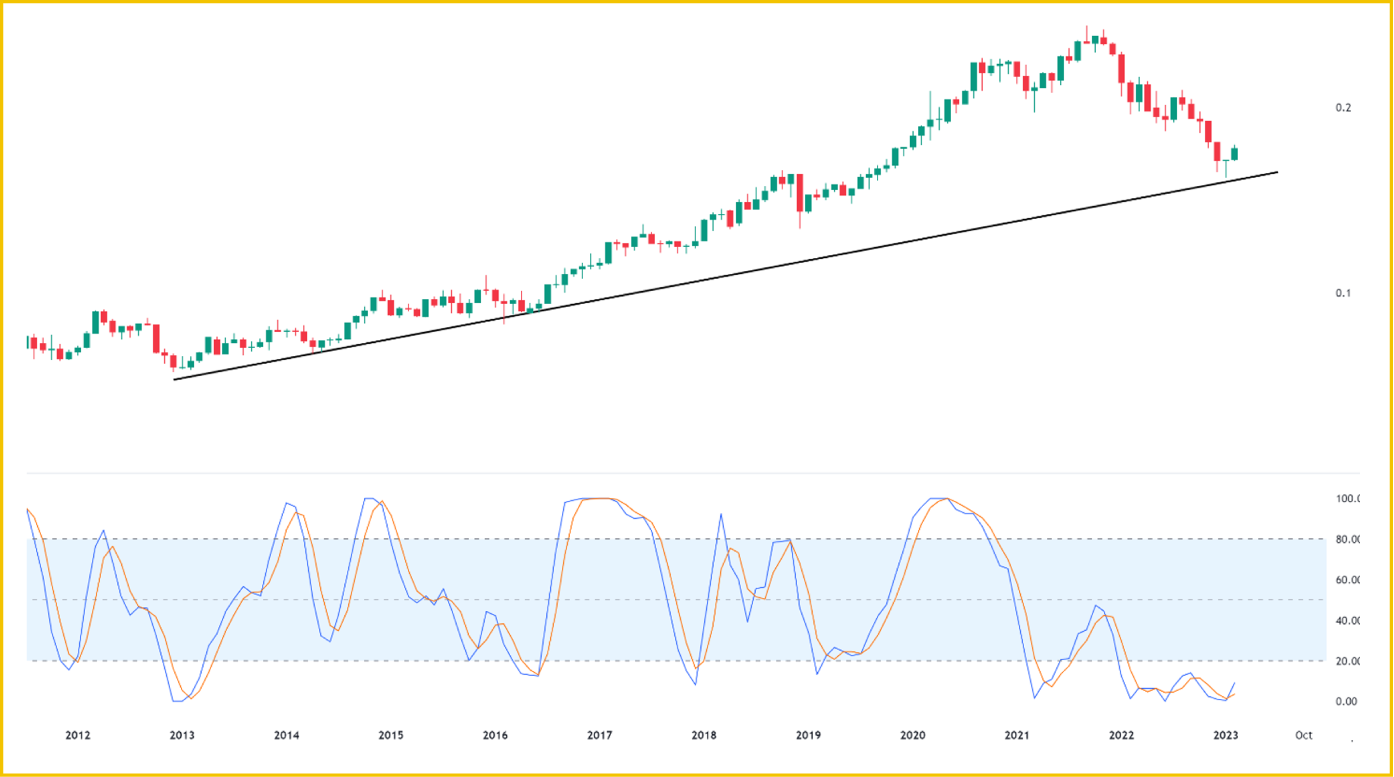
التحليل الفني
يُظهر مخطط النسبة في Nasdaq 100-South Africa انتعاشًا محتملاً من دعم خط الاتجاه القوي لمدة 10 سنوات ، مما يوفر فرصة جيدة لدخول تجارة NASA. بالإضافة إلى ذلك ، ووفقًا لمؤشر Stochastic-RSI ، فإن سعر نسبة NASA يتم تداوله حاليًا في منطقة ذروة البيع ، مما يعني أن الزوج في وضع جيد من منظور العائد.
مخطط نسبة NASA
Data Source: Bloomberg
Date: 08/02/2023
ملاحظة: يتضمن حساب العائد الاحتفاظ بالتكلفة والفائدة المستلمة في الإستراتيجية ، وقد يتغير هذا في المستقبل ، مما يؤثر على الإستراتيجية إما إيجابًا أو سلبًا. العوائد لا تأخذ في الاعتبار انخفاض قيمة الراند. يمكن للمستثمرين التطلع إلى التحوط من تعرض العملة بشكل منفصل
من الضروري ملاحظة أن تداول الأزواج ليس استراتيجية خالية من المخاطر. تأتي الصعوبة عندما تتحرك أسعار الأوراق المالية على عكس المواقف التي تم اتخاذها ، مما يؤدي إلى حدوث خسائر. وبالتالي ، فإن الالتزام بقواعد إدارة المخاطر الصارمة أمر حيوي عند التعامل مع المواقف المعاكسة.
Data Source: Bloomberg
Data & Prices as of : 08/02/2023
Risks and Assumptions for Back-tested trading strategies

Data Source: Bloomberg
Data: 30/01/2023
Arun Leslie John
Chief Market Analyst
Disclaimer: Century Financial Consultancy LLC (“CFC”) is Limited Liability Company incorporated under the Laws of UAE and is duly licensed and regulated by the Emirates Securities and Commodities Authority of UAE (SCA).This document is a marketing material and is for informational purposes only and must not be construed to be an advice to invest or otherwise in any investment or financial product. CFC does not guarantee as to adequacy, accuracy, completeness or reliability of any information or data contained herein and under no circumstances whatsoever none of such information or data be construed as an advice or trading strategy or recommendation to deal (Buy/Sell) in any investment or financial product. CFC is not responsible or liable for any result, gain or loss, based on this information, in whole or in part. Please carefully read disclaimer mentioned below/next page/next frame.
PLEASE READ THE FOLLOWING TERMS AND CONDITIONS OF ACCESS FOR THE PUBLICATION BEFORE THE USE THEREOF.
By use of the publication and continuing to access the publication, you accept these terms and conditions and undertake to be bound by the acceptance. CFC reserves the right to amend, remove, or add to the publication and Disclaimer at any time without any prior notice to you. Such modifications may be effective immediately or otherwise. Accordingly, please continue to review this Disclaimer whenever accessing, or using the publication. Your access of, and use of the publication, after modifications to the Disclaimer will constitute your acceptance of the terms and conditions of use of the publication, as modified. If, at any time, you do not wish to accept the content of this Disclaimer, you may not access, or use the publication. Any terms and conditions proposed by you which are in addition to or which conflict with this Disclaimer are expressly rejected by CFC and shall be of no force or effect.
No information as given herein by CFC in this publication should be construed as an offer, recommendation or solicitation to purchase or dispose of any securities/financial instruments/products or to enter in any transaction or adopt any hedging, trading or investment strategy. The data/information contained in the publication is not designed to initiate or conclude any transaction. Neither this publication nor anything contained herein shall form the basis of any contract or commitment whatsoever. Distribution of this publication does not oblige CFC to enter into any transaction. The information in this document is not intended, by itself, to constitute independent, impartial or objective research or a recommendation from CFC and should not be treated as such.
The content of this publication should not be considered legal, regulatory, credit, tax or accounting advice. Anyone proposing to rely on or use the information contained in the publication should independently verify and check the accuracy, completeness, reliability and suitability of the information and should obtain independent and specific advice from appropriate professionals or experts regarding information contained in this publication. CFC cannot be held responsible for the impact of any transactional costs or any taxes as may be applicable on transactions.
Information contained herein is based on various sources, including but not limited to public information, annual reports and statistical data that CFC considers reliable. However, CFC makes no representation or warranty as to the accuracy or completeness of any report or statistical data made in or in connection with this publication and accepts no responsibility whatsoever for any loss or damage caused by any act or omission taken as a result of the information contained in this publication. References to any financial instrument or investment product does not imply that an actual trading market exists for such instrument or product. In publishing this document CFC is not acting in the capacity of a fiduciary or financial advisor.
The report does not take into account the investment objectives, financial situations and specific needs of recipients. The recipient of this publication must make its own independent decisions regarding whether this communication and any securities or financial instruments mentioned herein, is appropriate in the light of its investment objectives, investment experience, financial situation, existing portfolio holdings and/or investment needs. Recipients will need to decide on their own as to whether or not the contents of this document are suitable for them.
This document is a marketing material and has been prepared by individual(s), marketing and/or research personnel of CFC. It has not been prepared in accordance with legal requirements designed to promote the independence of investment research and as such is purely a marketing communication. In this publication, any opinions, news, research, analysis, prices, or other information constitute is a general market commentary, and do not constitute the opinion or advice of CFC or any form of personal or investment advice. CFC neither endorses nor guarantees offerings of third party, nor is CFC responsible for the content, veracity or opinions of third-party speakers, presenters, participants or providers. CFC will not accept liability for any loss or damage, including without limitation to, any loss of profit, which may arise directly or indirectly from use of or reliance on such information.
Charts, graphs and related data or information provided in this publication are intended to serve for illustrative purposes only. The information contained in this publication is prepared as of a particular date and time and will not reflect subsequent changes in the market or changes in any other factors relevant to their determination. All statements as to future matters are not guaranteed to be accurate. CFC expressly disclaims any obligation to update or revise any forward-looking statements to reflect new information, events or circumstances after the date of this publication or to reflect the occurrence of unanticipated events.
The information in this communication cannot disclose everything about the nature and risks of the abovementioned data / information. This is not an exhaustive list of the risks involved, nor should it be regarded as offering advice on the suitability of these investments for the recipient.
All views expressed in all reports, analysis and documents are subject to change without notice. CFC may have issued other reports, analysis or other documents expressing different views from the contents hereof. Staff members/employees of CFC may provide/present oral or written market commentary or analysis to you that reflect opinions that are contrary to the opinions expressed in this research and may contain insights and reports that are inconsistent with the views expressed in this publication. Neither CFC nor any of its affiliates, group companies, directors, employees, agents or representatives assume any liability nor shall they be made liable for any damages whether direct, indirect, special or consequential including loss of revenue or profits that may arise from or in connection with the use of the information provided in this publication.
Information or data provided by means in this publication may have many inherent limitations, like module errors or lack accuracy in its historical data. Data included in the publication may rely on models that do not reflect or take into account all potentially significant factors such as market risk, liquidity risk, credit risk etc.
CFC and its affiliates reserve the right to act upon or use the contents hereof at any time, including before its publication herein. The use of our information, products and services should be on your own due diligence and you agree that CFC is not liable for any failure to achieve desired return on investment that is in any manner related to availing of services or products of CFC and use of our information, products and services. You acknowledge and agree that past investment performance is not indicative of the future performance results of any investment and that the information contained herein is not to be used as an indication for the future performance of any investment activity. Any prices provided in this document are indicative only and do not represent firm quotes as to either price or size. The value of any investment or income may go down as well as up. All investments involve an element of risk, including capital loss.
This publication is being furnished to you solely for your information and neither it nor any part of it may be used, forwarded, disclosed, distributed or delivered to anyone else. You may not copy, reproduce, display, modify or create derivative works from any data or information contained in this publication. This document may not be published, circulated, reproduced, or distributed in whole or part to any other person (whether within or in a jurisdiction outside UAE) without the prior written consent of CFC.
Declaration of the Financial Analyst
The analyst(s) who prepared this report certifies that the opinions contained herein accurately and exclusively reflect his or her views. The Analyst further undertakes that he or she has taken reasonable care to maintain independence and objectivity in respect of the opinions herein. The analyst(s) who wrote this report does not hold securities in the Company mentioned in the report. The analyst(s) receives a fixed compensation from CFC. No part of his or her compensation was, is, or will be directly or indirectly related to the inclusion of specific recommendations or views in this report. The business solicitation or marketing departments of CFC are separate and independent from the reporting line of the analyst(s). The analyst(s) confirms that he or she and his / her associates do not serve as directors or officers of the Company, and the Company or other third parties have not provided or agreed to provide any compensation or other benefits to the analyst(s) in connection with this report. An “associate” is defined as the spouse, parent or step-parent, or any minor child (natural or adopted) or minor step-child, of the analyst.
Services offered by CFC include products that are traded on margin and can result in losses that exceed deposits. Before deciding to trade on margin products, you should consider your investment objectives, risk tolerance and your level of experience on these products. Trading with leverage carries significant risk of losses and as such margin products are not suitable for every investor and you should ensure that you understand the risks involved and should seek independent advice from professionals or experts if necessary.


تنظمها هيئة الأوراق المالية والسلع
سنشري للاستشارات المالي ش.ذ.م.م


تصل إلينا:
-
دبي
الطابق رقم 6, مبنى رقم 4, ساحة إعمار دبي
وسط مدينة دبي، ص.ب: 65777،
دبي، الإمارات العربية المتحدة -
Abu Dhabi
27th Floor, Office 2701,
Shining Towers, Abu Dhabi, UAE -
Sharjah
29th Floor, Office 2905,
The Business Tower, Sharjah, UAE - +971 (4) 356 2800
- info@century.ae

Century Financial is the presenting sponsor of

ينطوي التداول في المنتجات المالية على مخاطر كبيرة. فالاعتماد على المشتقات المالية المتاحة للتداول خارح البورصة، مثل عقود الفروقات وتداول العملات الأجنبية (الفوركس) الفوري، قد يتسبب في خسائر تتجاوز قيمة الإيداعات الأولية، مما يجعلها غير ملائمة لجميع المستثمرين. فهذه الأدوات المالية المعقدة لا تمنح ملكية مباشرة للأصول الأساسية. لذا، ينبغي للمستثمرين الاحتراز عند تحديد أهدافهم الاستثمارية ومراعاة مستوى المخاطرة المتوقَع، واللجوء إلى الاستشارة المهنية المتخصصة عند الضرورة.
سنشري للإستشارات والتحليل المالي ش.ذ.م.م (الشركة)، شركة مرخّصة ومنظمة من هيئة الأوراق المالية والسلع في دولة الإمارات العربية المتحدة، بموجب الترخيص رقم (20200000028) و(301044) لتولي أعمال الوساطة في الأسواق الدولية، وتداول المشتقات المالية والعملات المتاحة للتداول خارج البورصة في سوق التداول الفوري، بالإضافة إلى تقديم الخدمات الاستشارية والترويجية. تأسست الشركة بموجب قوانين دولة الإمارات العربية المتحدة، وهي مسجلة لدى دائرة التنمية الاقتصادية بدبي (رقم: 768189)، حيث يقع مكتبها المسجّل في 601، الطابق السادس، المبنى رقم 4، ميدان إعمار، وسط مدينة دبي، دولة الإمارات العربية المتحدة، ص.ب. 65777.
لا يُعرَض محتوى هذا الموقع الإلكتروني إلا لأغراض تعريفية تثقيفية بحتة، فلا يمثل عرضًا ولا توصيةً ولا دعوةً لشراء أو بيع أي أوراق مالية أو منتجات مالية.
لا تنوي الشركة استخدام أو توزيع منتجاتها وخدماتها في أي ولاية قضائية حيث يُشكِّل هذا الاستخدام أو التوزيع انتهاكًا للقوانين المحلية أو اللوائح التنظيمية.
