Recognizing trading patterns is one of the most versatile skills you can learn when it comes to trading. This is the branch of technical analysis that focuses on finding price (and often volume) patterns.
Trading using price patterns can help you to identify shifts between rising and falling trends. Traders look for price patterns that signal changes in the market’s trend, and then execute trades based on these signals. Trading patterns can also be used to forecast market reversals and trend continuations.
The key is to spend time learning the basic rules so you can use these methods most effectively with your trading strategy.
While the idea of pattern recognition may seem strange, it's based on carefully tested methods which underline their usefulness to traders. Importantly, patterns are factors to consider when calculating where to enter, set stop-loss orders, and where to set your profit targets. These factors are, of course, some of the key things that all traders will wish to consider when managing their overall portfolio.
- Recognise how price movements can develop into price patterns
- Isolate sensible entry points
- Manage risk with stop losses and set profit targets
Types of trading patterns
Pattern recognition comes from looking for patterns that appear in the prices of traded instruments. You should be looking for shapes such as triangles, rectangles and diamonds. While this may not inspire confidence at the outset, these are formations that arise and track the changes in support and resistance.
Once you have learnt these skills, you will be able to apply them in any financial market that you choose, from shares to indices and forex. Pattern recognition can form the basis of trading strategies for day traders, swing traders and longer-term position traders alike and can be applied to anything from five-minute to weekly charts.
Rectangles and, in particular, triangles, have a wide number of varieties that can be used. In essence, all price patterns are looking at the interaction of supply and demand over time and establishing sensible ways in which to react when these patterns form. This means you will know how you to react in terms of risk management and closing out.
Triangle trading patterns
There are several different types of triangles which can all be very effective for your trading. One advantage is that there is no bias to either the long or short side, and this makes them very useful from the perspective of a CFD trader. Keep in mind that if you are always biasing yourself to the long side of the market, then you could be missing out on some of the most attractive features of this pattern.
Triangles are patterns inside which the price consolidates. However, because there is no long or short side bias, you must keep an eye on triangles for when an eventual breakout occurs. There are two broad categories of triangle that form:
- The ascending and descending triangle (the opposite of one another), and
- The symmetrical triangle
Ascending triangle
The ascending triangle is possibly the best recognised pattern in this category, as it incorporates the use of a resistance line (which traders are frequently on the lookout for) and a rising support line.
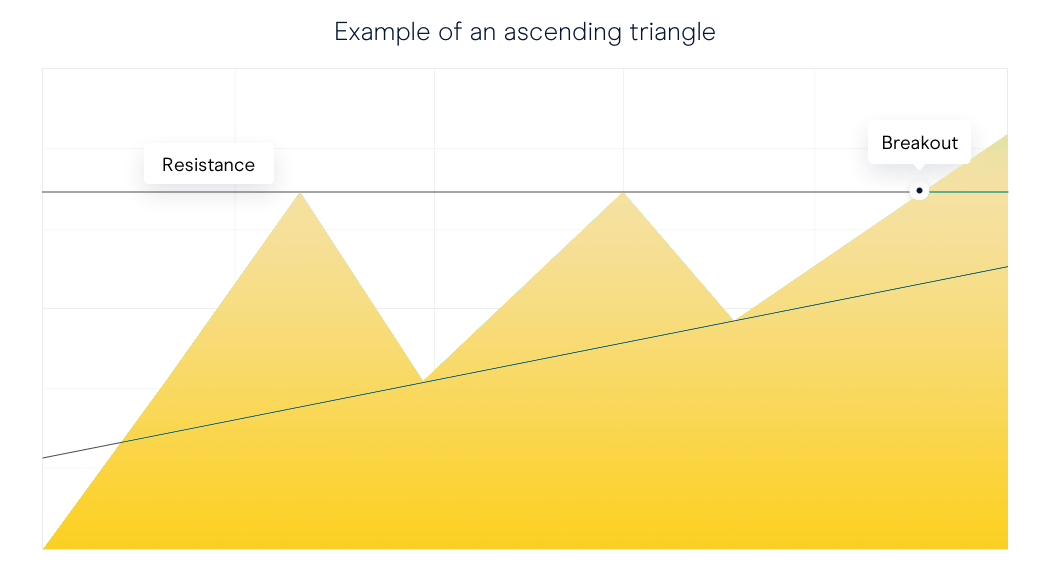
The important parts of this formation are the two lines marked in red: the resistance line and uptrend line. You should be mindful of trading volumes during the formation of the pattern, and then how volumes are affected when the breakout occurs.
Typically, you would look for volume levels to decline over the time that the pattern forms. One way to think about this decline is that buyers and sellers gradually get pushed into a narrower and narrower balance of support and resistance, which effectively drives out the interest until price can break out and begin to trend once more. If volume isn't declining, this doesn't necessarily mean that there is a problem with the pattern; however, something you should be on the lookout for is a volume spike when the breakout occurs. This tends to have a beneficial effect on the overall strength of the pattern from then on.
Another effect that can be greatly beneficial to look out for when breakouts occur is a gap in the price. This shows a surge in demand for the instrument (surge in supply if it's a short trade) which adds a great deal of price confirmation for the trader. Traders may sometimes be put off by this because they feel the trade has got away from them, but in reality this is likely to be reinforcement that you have correctly determined a breakout is occurring.
Something that traders all fear when it comes to breakout pattern trades is what is known as the false breakout, or whipsaw. This occurs when price breaches the pattern, which may lead aggressive traders to move straight into the trade. Unfortunately, what happens in the case of the false breakout is that you get what seems to be a genuine signal, only to find out later that the price retreats back within the confines of the pattern, and you are left holding a trade that is not doing what you hoped it would.
The only way you can try to combat this is by applying a filter of some sort, and the most obvious method is to wait until there have been X closes outside of the pattern. If you are looking at daily charts, then you may decide to wait until the price has closed outside of the pattern for two days before entry. There are other means of avoiding this type of false breakout. Some traders choose to wait until the price has moved twice the average true range (2ATR) outside of the pattern. None of these methods will guarantee that you won't suffer false breakouts.
The previous chart demonstrated an example of an ascending triangle with an upward breakout. As there is no directional bias as to which way patterns are going to break out, we also need to look at an example of what a downward break on an ascending triangle looks like.
.png)
You can see that the basic setup is exactly the same, except the breakout occurs in the opposite direction which then necessitates a short trade. You should note that in the case of both these examples we have shown a retracement back to the line from which they broke out. This is something that can happen without the signal being considered a failure – however, you should not assume this will always happen. In fact, you would assume that the instances where this does not occur are when you are receiving the strongest signals.
Descending triangle
The flipside of the previously described ascending triangle is the descending triangle, which has very similar characteristics but sets itself up in the opposite direction. As with its ascending counterpart, the breakout can occur in either direction, so you need to watch the direction in which the breakout occurs.

As with all patterns, they rarely look exactly the same as in these examples. These illustrations provide something of a best-case scenario, but most of the time you will want to see the price movements resemble the chart as closely as possible.
Some traders would suggest that the price should drive quite clearly from the support and resistance points and not spend too much time drifting sideways. And when it comes to triangle patterns, you would preferably see the price break out of the pattern before it reaches 75% of the way to the apex. This is because if the pattern continues sideways it's starting to lose momentum and may continue to drift sideways, which is far from what the breakout trader wants.
.png)
Symmetrical triangle
The symmetrical triangle has some characteristics in common with the ascending/descending triangle in that the price is being driven into a narrower band of price movement, and the trader is looking for a breakout of the price. In addition, you will probably see the level of trading volume in the instrument decline as it moves throughout the formation, and then subsequently rise significantly above the average when the breakout occurs.
As with other triangles, there is the possibility of false breakouts, so it's worth considering placing a filter on the breakout to reduce your chances of being exposed to a whipsaw entry into the trade. Again, this may be a set number of closes above the breakout level or, alternatively, using a filter like the average true range.
In these trades as with any of the triangles, there are two main choices as to where stop-loss orders are placed. The more aggressive trader might place a stop just on the other side of the breakout line, where the whipsaw is likely to have occurred. This is as close as a stop-loss can realistically be placed, because otherwise you aren't really giving the trade a decent chance of success. The alternative and more conservative method is to put the stop on the far side of the pattern completely, which would show a total failure of the setup if that level is reached.
Rectangle trading patterns
Having looked at setups where the support and resistance levels are moving closer together, the rectangle setup shows where the two levels run parallel to one another. Although the pattern looks very different to any of the triangle family, the behaviours in terms of the setups are quite similar, in terms of the breakout and risk management.
.png)
This chart again illustrates the breakout having a subsequent throwback to what was the resistance line, but this will not always be the case. Like the triangle, the best outcome is a strong continuation from this level on high volume from the point of the breakout.
Flag trading patterns
Like the pennant, the flag is a shorter-term version of a similar pattern – in this case a channel. Flags require many of the same characteristics as the pennant in order to be confirmed as genuine.
This pattern is only genuine if the breakout occurs in the same direction in which price entered it. You will also tend to see the direction of the flag move in the opposite direction of the prevailing price movement.
.png)
Both the flag and pennant occur after a sharp movement in price – this near-vertical price move forms the ‘flag pole’ on which the pennant or the flag occurs. It's important to see this in the lead-up because the pattern is not genuine without it. Lastly, you are likely to see a spike in volume in both cases on the breakout, which will add to the confirmation of the pattern.
The placement of stops obeys the same basic rules as above, with more aggressive traders closing trades at the first sign of failure, while a more conservative trader might look for a price to cross the pattern entirely before regarding it a failure.
Price targets
It's possible to use all the patterns discussed to target an eventual profit-taking point. In the case of the triangles and the rectangle, this is done easily by measuring the height of the pattern and then extrapolating the target out from the breakout point.
.png)
The same basic premise is applied to the rectangle. In the case of flags and pennants, the target is determined by measuring the height of the flagpole leading into the formation and then added on the way out. These formations are sometimes referred to as measuring formations because they often occur halfway through the price swing.
Summary
- You should recognize basic price conditions required for a pattern to be genuine
- You should know how to tell when a pattern has failed
- You should be able to generate a sensible risk-management plan in line with your pattern-recognition skill
Source: CMC Markets UK
Disclaimer: Century Financial Consultancy LLC (“CFC”) is Limited Liability Company incorporated under the Laws of UAE and is duly licensed and regulated by the Emirates Securities and Commodities Authority of UAE (SCA). This document is a marketing material and is for informational purposes only and must not be construed to be an advice to invest or otherwise in any investment or financial product. CFC does not guarantee as to adequacy, accuracy, completeness or reliability of any information or data contained herein and under no circumstances whatsoever none of such information or data be construed as an advice or trading strategy or recommendation to deal (Buy/Sell) in any investment or financial product. CFC is not responsible or liable for any result, gain or loss, based on this information, in whole or in part.
PLEASE READ THE FOLLOWING TERMS AND CONDITIONS OF ACCESS FOR THE PUBLICATION BEFORE THE USE THEREOF.
By use of the publication and continuing to access the publication, you accept these terms and conditions and undertake to be bound by the acceptance. CFC reserves the right to amend, remove, or add to the publication and Disclaimer at any time without any prior notice to you. Such modifications shall be effective immediately. Accordingly, please continue to review this Disclaimer whenever accessing, or using the publication. Your access of, and use of the publication, after modifications to the Disclaimer will constitute your acceptance of the terms and conditions of use of the publication, as modified. If, at any time, you do not wish to accept the content of this Disclaimer, you may not access, or use the publication. Any terms and conditions proposed by you which are in addition to or which conflict with this Disclaimer are expressly rejected by CFC and shall be of no force or effect.
No information as given herein by CFC in this publication should be construed as an offer, recommendation or solicitation to purchase or dispose of any securities/financial instruments/products or to enter in any transaction or adopt any hedging, trading or investment strategy. Neither this publication nor anything contained herein shall form the basis of any contract or commitment whatsoever. Distribution of this publication does not oblige CFC to enter into any transaction.
The content of this publication should not be considered legal, regulatory, credit, tax or accounting advice. Anyone proposing to rely on or use the information contained in the publication should independently verify and check the accuracy, completeness, reliability and suitability of the information and should obtain independent and specific advice from appropriate professionals or experts regarding information contained in this publication. CFC cannot be held responsible for the impact of any transactional costs or any taxes as may be applicable on transactions.
Information contained herein is based on various sources, including but not limited to public information, annual reports and statistical data that CFC considers reliable. However, CFC makes no representation or warranty as to the accuracy or completeness of any report or statistical data made in or in connection with this publication and accepts no responsibility whatsoever for any loss or damage caused by any act or omission taken as a result of the information contained in this publication. The articles does not take into account the investment objectives, financial situations and specific needs of recipients. The recipient of this publication must make its own independent decisions regarding whether this communication and any securities or financial instruments mentioned herein, is appropriate in the light of its existing portfolio holdings and/or investment needs.
This document is a marketing material and has been prepared by individual(s), marketing and/or research personnel of CFC. It has not been prepared in accordance with legal requirements designed to promote the independence of investment research and as such is purely a marketing communication. In this publication, any opinions, news, research, analysis, prices, or other information constitute is a general market commentary, and do not constitute the opinion or advice of CFC or any form of personal or investment advice. CFC neither endorses nor guarantees offerings of third party, nor is CFC responsible for the content, veracity or opinions of third-party speakers, presenters, participants or providers. CFC will not accept liability for any loss or damage, including without limitation to, any loss of profit, which may arise directly or indirectly from use of or reliance on such information.
Charts, graphs and related data or information provided in this publication are intended to serve for illustrative purposes only. The information contained in this publication is prepared as of a particular date and time and will not reflect subsequent changes in the market or changes in any other factors relevant to their determination. All statements as to future matters are not guaranteed to be accurate. CFC expressly disclaims any obligation to update or revise any forward-looking statements to reflect new information, events or circumstances after the date of this publication or to reflect the occurrence of unanticipated events.
Staff members/employees of CFC may provide/present oral or written market commentary or analysis to you that reflect opinions that are contrary to the opinions expressed in this research and may contain insights and reports that are inconsistent with the views expressed in this publication. Neither CFC nor any of its affiliates, group companies, directors, employees, agents or representatives assume any liability nor shall they be made liable for any damages whether direct, indirect, special or consequential including loss of revenue or profits that may arise from or in connection with the use of the information provided in this publication.
Information or data provided by means in this publication may have many inherent limitations, like module errors or lack accuracy in its historical data. Data included in the publication may rely on models that do not reflect or take into account all potentially significant factors such as market risk, liquidity risk, credit risk etc.
The use of our information, products and services should be on your own due diligence and you agree that CFC is not liable for any failure to achieve desired return on investment that is in any manner related to availing of services or products of CFC and use of our information, products and services. You acknowledge and agree that past investment performance is not indicative of the future performance results of any investment and that the information contained herein is not to be used as an indication for the future performance of any investment activity.
This publication is being furnished to you solely for your information and neither it nor any part of it may be used, forwarded, disclosed, distributed or delivered to anyone else. You may not copy, reproduce, display, modify or create derivative works from any data or information contained in this publication.
Services offered by CFC include products that are traded on margin and can result in losses that exceed deposits. Before deciding to trade on margin products, you should consider your investment objectives, risk tolerance and your level of experience on these products. Trading with leverage carries significant risk of losses and as such margin products are not suitable for every investor and you should ensure that you understand the risks involved and should seek independent advice from professionals or experts if necessary.
هل أنت مستعد للاستثمار؟
استكشف تجربة تداول جديدة مع
تطبيق سنشري تريدر
يمكن أن تتجاوز الخسائر قيمة إيداعاتك
هل أنت مستعد للاستثمار؟
استكشف تجربة تداول جديدة مع
تطبيق سنشري تريدر
يمكن أن تتجاوز الخسائر قيمة ودائعك

تنظمها هيئة الأوراق المالية والسلع
سنشري للاستشارات المالي ش.ذ.م.م


تصل إلينا:
-
دبي
الطابق رقم 6, مبنى رقم 4, ساحة إعمار دبي
وسط مدينة دبي، ص.ب: 65777،
دبي، الإمارات العربية المتحدة -
Abu Dhabi
27th Floor, Office 2701,
Shining Towers, Abu Dhabi, UAE -
Sharjah
29th Floor, Office 2905,
The Business Tower, Sharjah, UAE - +971 (4) 356 2800
- info@century.ae

Century Financial is the presenting sponsor of

ينطوي التداول في المنتجات المالية على مخاطر كبيرة. فالاعتماد على المشتقات المالية المتاحة للتداول خارح البورصة، مثل عقود الفروقات وتداول العملات الأجنبية (الفوركس) الفوري، قد يتسبب في خسائر تتجاوز قيمة الإيداعات الأولية، مما يجعلها غير ملائمة لجميع المستثمرين. فهذه الأدوات المالية المعقدة لا تمنح ملكية مباشرة للأصول الأساسية. لذا، ينبغي للمستثمرين الاحتراز عند تحديد أهدافهم الاستثمارية ومراعاة مستوى المخاطرة المتوقَع، واللجوء إلى الاستشارة المهنية المتخصصة عند الضرورة.
سنشري للإستشارات والتحليل المالي ش.ذ.م.م (الشركة)، شركة مرخّصة ومنظمة من هيئة الأوراق المالية والسلع في دولة الإمارات العربية المتحدة، بموجب الترخيص رقم (20200000028) و(301044) لتولي أعمال الوساطة في الأسواق الدولية، وتداول المشتقات المالية والعملات المتاحة للتداول خارج البورصة في سوق التداول الفوري، بالإضافة إلى تقديم الخدمات الاستشارية والترويجية. تأسست الشركة بموجب قوانين دولة الإمارات العربية المتحدة، وهي مسجلة لدى دائرة التنمية الاقتصادية بدبي (رقم: 768189)، حيث يقع مكتبها المسجّل في 601، الطابق السادس، المبنى رقم 4، ميدان إعمار، وسط مدينة دبي، دولة الإمارات العربية المتحدة، ص.ب. 65777.
لا يُعرَض محتوى هذا الموقع الإلكتروني إلا لأغراض تعريفية تثقيفية بحتة، فلا يمثل عرضًا ولا توصيةً ولا دعوةً لشراء أو بيع أي أوراق مالية أو منتجات مالية.
لا تنوي الشركة استخدام أو توزيع منتجاتها وخدماتها في أي ولاية قضائية حيث يُشكِّل هذا الاستخدام أو التوزيع انتهاكًا للقوانين المحلية أو اللوائح التنظيمية.
