What are Bollinger Bands?
Bollinger Bands are a widely used technical analysis tool that helps traders determine if an asset’s price is relatively high or low. Created by John Bollinger in the 1980s, these bands can be applied to various financial assets, including stocks, currencies, and indices.
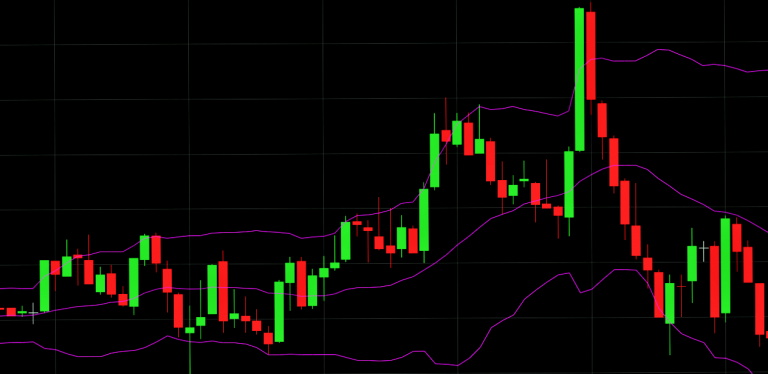
The indicator is composed of three lines:
- Middle Line – A simple moving average (SMA) of the asset’s price.
- Upper Band – The SMA plus two standard deviations.
- Lower Band – The SMA minus two standard deviations.
These bands give traders insight into whether an asset is overbought or oversold. Prices near the upper band often signal that the asset may be overbought, while prices near the lower band can indicate it's oversold.
Assessing Volatility
Bollinger Bands also help gauge market volatility. Narrow bands suggest calm, low-volatility periods, while wider bands indicate heightened volatility. Traders often use them alongside other indicators to profit from these price extremes.
How to Use Bollinger Bands?
When applied to a chart, Bollinger Bands appear as an envelope around the price. The middle line is the asset’s 20-day SMA, while the bands represent two standard deviations above and below this average.
- Upper Band = 20-day SMA + (20-day standard deviation x 2)
- Lower Band = 20-day SMA – (20-day standard deviation x 2)
The width of the bands reflects volatility, with larger gaps during high volatility and narrower bands during calm market conditions. Traders can use them on various timeframes, from five-minute to weekly charts, adjusting the settings to fit their strategy.
- Overbought Signal: When the price nears the upper band, it’s often a sign that the asset is overbought, signaling potential sell opportunities.
- Oversold Signal: Prices near the lower band suggest the asset is oversold, signaling potential buying opportunities.
While Bollinger Bands are valuable, they’re most effective when combined with other technical indicators for more reliable signals.
Complementary Indicators
For more accurate trading signals, traders often use Bollinger Bands alongside other technical analysis tools such as:
- Moving Averages: Help traders identify trend direction. A price above the moving average suggests an uptrend, while a price below indicates a downtrend.
- Stochastic Indicators: Measure momentum and are useful for spotting trend reversals, much like Bollinger Bands.
- Average True Range (ATR): This indicator measures volatility and is particularly helpful when used with Bollinger Bands to find entry and exit points.
- Keltner Channels: Similar to Bollinger Bands but use the average true range (ATR) and an exponential moving average for a different view of volatility.
Popular Bollinger Band Trading Strategies
Here are some key strategies that traders use to capitalize on market trends:
- Double Bottoms: This pattern occurs when an asset’s price dips sharply below the lower band, rebounds, then dips again but with less intensity. This shift from selling to buying pressure often signals an upward reversal, with traders targeting the middle or upper bands for profits.
- Reversals: When the price moves outside the upper band but closes near the lower end of its interval, it could signal an impending downtrend. Conversely, a close above the lower band might indicate an upcoming uptrend.
- Riding the Bands: Prices touching the upper or lower bands don’t necessarily signal immediate sell or buy decisions. In strong trends, prices can remain within the bands for extended periods, so additional confirmation is often needed before entering trades.
- Bollinger Band Squeeze: When the bands contract to their narrowest point in six months, traders expect increased volatility. This "squeeze" often precedes a significant price movement, either up or down.
Timeframes and Effectiveness
Bollinger Bands are flexible and can be used across different timeframes. Long-term investors may prefer monthly charts, while day traders often set up Bollinger Bands on five-minute charts.
However, it’s important to remember that Bollinger Bands are reactive, not predictive. They respond to past price data and, as such, may produce false signals. The default settings may not fit every strategy, so adjustments are often necessary. For example, long-term traders might prefer a longer period and higher standard deviation, while short-term traders might use shorter settings.
Summary
Bollinger Bands are a versatile technical analysis tool for assessing volatility and trend strength. They appear as three lines on a chart, with the middle line representing the moving average and the outer lines showing standard deviations. While they can signal overbought or oversold conditions, they’re best used with other indicators to avoid false signals.
Popular strategies include identifying double bottoms, trend reversals, and squeeze patterns. But as Bollinger Bands are based on historical data, they react to price changes rather than predicting them, so combining them with additional tools will give traders a more well-rounded strategy.
Disclaimer: Century Financial Consultancy LLC (“CFC”) is Limited Liability Company incorporated under the Laws of UAE and is duly licensed and regulated by the Emirates Securities and Commodities Authority of UAE (SCA). This document is a marketing material and is for informational purposes only and must not be construed to be an advice to invest or otherwise in any investment or financial product. CFC does not guarantee as to adequacy, accuracy, completeness or reliability of any information or data contained herein and under no circumstances whatsoever none of such information or data be construed as an advice or trading strategy or recommendation to deal (Buy/Sell) in any investment or financial product. CFC is not responsible or liable for any result, gain or loss, based on this information, in whole or in part.
PLEASE READ THE FOLLOWING TERMS AND CONDITIONS OF ACCESS FOR THE PUBLICATION BEFORE THE USE THEREOF.
By use of the publication and continuing to access the publication, you accept these terms and conditions and undertake to be bound by the acceptance. CFC reserves the right to amend, remove, or add to the publication and Disclaimer at any time without any prior notice to you. Such modifications shall be effective immediately. Accordingly, please continue to review this Disclaimer whenever accessing, or using the publication. Your access of, and use of the publication, after modifications to the Disclaimer will constitute your acceptance of the terms and conditions of use of the publication, as modified. If, at any time, you do not wish to accept the content of this Disclaimer, you may not access, or use the publication. Any terms and conditions proposed by you which are in addition to or which conflict with this Disclaimer are expressly rejected by CFC and shall be of no force or effect.
No information as given herein by CFC in this publication should be construed as an offer, recommendation or solicitation to purchase or dispose of any securities/financial instruments/products or to enter in any transaction or adopt any hedging, trading or investment strategy. Neither this publication nor anything contained herein shall form the basis of any contract or commitment whatsoever. Distribution of this publication does not oblige CFC to enter into any transaction.
The content of this publication should not be considered legal, regulatory, credit, tax or accounting advice. Anyone proposing to rely on or use the information contained in the publication should independently verify and check the accuracy, completeness, reliability and suitability of the information and should obtain independent and specific advice from appropriate professionals or experts regarding information contained in this publication. CFC cannot be held responsible for the impact of any transactional costs or any taxes as may be applicable on transactions.
Information contained herein is based on various sources, including but not limited to public information, annual reports and statistical data that CFC considers reliable. However, CFC makes no representation or warranty as to the accuracy or completeness of any report or statistical data made in or in connection with this publication and accepts no responsibility whatsoever for any loss or damage caused by any act or omission taken as a result of the information contained in this publication. The articles does not take into account the investment objectives, financial situations and specific needs of recipients. The recipient of this publication must make its own independent decisions regarding whether this communication and any securities or financial instruments mentioned herein, is appropriate in the light of its existing portfolio holdings and/or investment needs.
This document is a marketing material and has been prepared by individual(s), marketing and/or research personnel of CFC. It has not been prepared in accordance with legal requirements designed to promote the independence of investment research and as such is purely a marketing communication. In this publication, any opinions, news, research, analysis, prices, or other information constitute is a general market commentary, and do not constitute the opinion or advice of CFC or any form of personal or investment advice. CFC neither endorses nor guarantees offerings of third party, nor is CFC responsible for the content, veracity or opinions of third-party speakers, presenters, participants or providers. CFC will not accept liability for any loss or damage, including without limitation to, any loss of profit, which may arise directly or indirectly from use of or reliance on such information.
Charts, graphs and related data or information provided in this publication are intended to serve for illustrative purposes only. The information contained in this publication is prepared as of a particular date and time and will not reflect subsequent changes in the market or changes in any other factors relevant to their determination. All statements as to future matters are not guaranteed to be accurate. CFC expressly disclaims any obligation to update or revise any forward-looking statements to reflect new information, events or circumstances after the date of this publication or to reflect the occurrence of unanticipated events.
Staff members/employees of CFC may provide/present oral or written market commentary or analysis to you that reflect opinions that are contrary to the opinions expressed in this research and may contain insights and reports that are inconsistent with the views expressed in this publication. Neither CFC nor any of its affiliates, group companies, directors, employees, agents or representatives assume any liability nor shall they be made liable for any damages whether direct, indirect, special or consequential including loss of revenue or profits that may arise from or in connection with the use of the information provided in this publication.
Information or data provided by means in this publication may have many inherent limitations, like module errors or lack accuracy in its historical data. Data included in the publication may rely on models that do not reflect or take into account all potentially significant factors such as market risk, liquidity risk, credit risk etc.
The use of our information, products and services should be on your own due diligence and you agree that CFC is not liable for any failure to achieve desired return on investment that is in any manner related to availing of services or products of CFC and use of our information, products and services. You acknowledge and agree that past investment performance is not indicative of the future performance results of any investment and that the information contained herein is not to be used as an indication for the future performance of any investment activity.
This publication is being furnished to you solely for your information and neither it nor any part of it may be used, forwarded, disclosed, distributed or delivered to anyone else. You may not copy, reproduce, display, modify or create derivative works from any data or information contained in this publication.
Services offered by CFC include products that are traded on margin and can result in losses that exceed deposits. Before deciding to trade on margin products, you should consider your investment objectives, risk tolerance and your level of experience on these products. Trading with leverage carries significant risk of losses and as such margin products are not suitable for every investor and you should ensure that you understand the risks involved and should seek independent advice from professionals or experts if necessary.
Ready to Invest?
Explore a new trading experience with
Century Trader App
Losses can exceed your deposits
Ready to Invest?
Explore a new trading experience with
Century Trader App
Losses can exceed your deposits

Regulated by CMA
Century Financial Consultancy LLC


.png)
.png)
.png)
.png)
.png)

Reach us:
-
Dubai
6th Floor, Emaar Square Building 4,
Downtown, Dubai, P.O. Box 65777,
Dubai, United Arab Emirates -
Abu Dhabi
27th Floor, Office 2701,
Shining Towers, Abu Dhabi, UAE -
Sharjah
29th Floor, Office 2905,
The Business Tower, Sharjah, UAE - +971 (4) 356 2800
- info@century.ae

Disclaimer: Trading in financial products carries substantial risk. Leveraged over-the-counter (OTC) derivatives, such as Contracts for Difference (CFDs) and spot forex, may result in losses exceeding initial deposits and may not be suitable for all investors. These complex instruments do not confer ownership of the underlying assets. Investors should carefully consider their investment objectives and risk appetite, and seek independent professional advice if necessary.
Century Financial Consultancy LLC (CFC) is licensed and regulated by the Capital Market Authority (CMA) of the UAE under license numbers 20200000028 and 301044 to carry out the activities of Financial Products dealer, Trading Broker in international markets, Trading Broker of OTC derivatives and currencies in the spot market, Introduction, Financial Consultations, and Promotion. CFC is incorporated under UAE law, registered with the Dubai Economic Department (No. 768189), with its office at 601, Level 6, Building No. 4, Emaar Square, Downtown Dubai, UAE, PO Box 65777.
The content on this website is provided solely for informational and educational purposes and does not constitute an offer, recommendation, or solicitation to buy or sell any securities or financial products.
Products and services offered by CFC are not intended for use in any jurisdiction where such use or distribution would breach local laws or regulatory requirements.
⚠️ Alert: Fraudulent Activity Notice
Century Financial Consultancy LLC (“Century”) has become aware of fraudulent individuals and entities impersonating our firm through unofficial websites, social media channels, and messaging applications such as Telegram, WhatsApp, and Discord.
Please be advised:
- Century does not manage investments on behalf of clients.
- Century does not solicit funds or guarantee investment returns.
- Century does not accept or make payments in cash, cryptocurrency, or digital assets.
- We do not conduct business via social media or messaging platforms.
Our only official website is www.century.ae, and all communication is conducted exclusively through verified channels.
We strongly urge the public to remain vigilant, verify the authenticity of any communication claiming to be from Century, and report any suspicious activity. Century disclaims any responsibility for losses arising from dealings with unauthorised or fraudulent parties.
