A trendline could also be called a ‘trend support line’ because it shows the direction of a trend, and it acts as a support line.
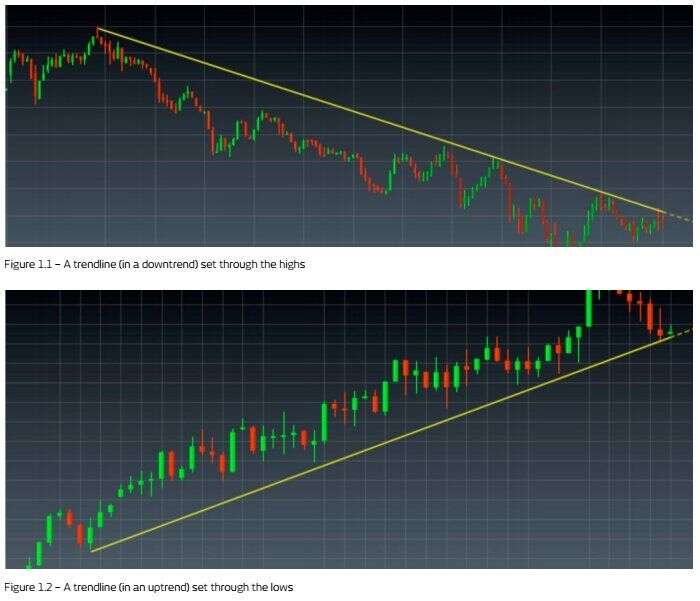
With downtrends, trendlines are formed by drawing a straight line through a series of descending lower highs. The charts below are examples of down and up trendlines. It's usual practice to join the highs or lows (wicks) of the candlesticks and not the closing prices.
Uptrend and downtrend examples
Common trendline and channel rules
These two rules are usually applied to trendlines and channels:
- Declines in price that approach an uptrend line, or price rises that approach a downtrend line, can be good opportunities to initiate positions in the same direction as the trendline.
- The penetration of an uptrend line, particularly on a closing basis, is a sell signal, and the penetration of a downtrend line is a buy signal. Normally, analysts apply a minimum percentage price move (1% breach on a stock for example) through the line or a minimum price move.
According to the first rule, as price approaches an uptrend line, the trendline (if it's a valid one) tends to act as a support, so one could buy as price approaches the line. The line must not be breached. If a trendline is cut through, then we can say in effect that a support has been breached and we could act as we would if it were a normal support break.
Conversely, downtrend lines tend to act as resistances. One could sell as the price approaches the line — again it must not be breached. In the chart immediately below, you will notice our entry points would be chosen with this in mind, providing 'cheaper' buy-in levels in an uptrend, nearer the trendline; and in a downtrend, providing higher levels to sell into a downtrend.

The 'sell' points in the above chart represent the ideal 'sell' orders, which would tend to cluster near and underneath a downtrend line. The reason they have to be underneath and not above, is that a downtrend line acts like a resistance line. Price action above the line would, by definition, be a 'technical break' over the line, which would mean a trader could expect a short-term spike, so could be looking to exit short trades rather than enter them.
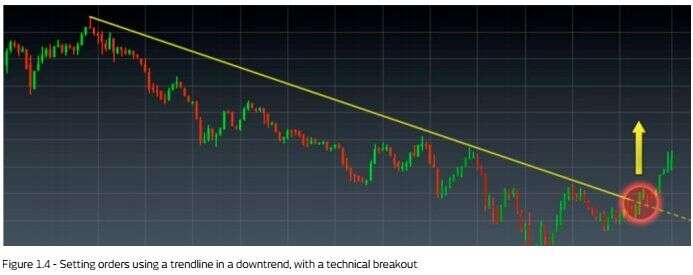
In this chart, you can see an example of a downtrend and trendline for most of the chart, with the ideal selling points (shown by the trendline) throughout the course of the downtrend. Then, as all good trends do, the trend comes to an end with the break of the downtrend line and resultant short-term spike that follows.
Redrawing trendlines
Changes in trend speed may necessitate the redrawing of lines. This is particularly important if they are breached temporarily, only to resume the trend, as this could make the lines themselves unreliable.

While penetrations of trendlines often warn of a trend reversal, a breach usually also means you will need to redraw a trendline, as shown by the chart above. It's not enough to show a trendline that works — it's important that the trend method also works.
Disclaimer: To read more about the disclaimer Click here
Ready to Invest?
Explore a new trading experience with
Century Trader App
Losses can exceed your deposits
Ready to Invest?
Explore a new trading experience with
Century Trader App
Losses can exceed your deposits

Regulated by SCA
Century Financial Consultancy LLC


Reach us:
-
Dubai
6th Floor, Emaar Square Building 4,
Downtown, Dubai, P.O. Box 65777,
Dubai, United Arab Emirates -
Abu Dhabi
27th Floor, Office 2701,
Shining Towers, Abu Dhabi, UAE - +971 (4) 356 2800
- info@century.ae

Disclaimer: Trading in financial products carries substantial risk. Leveraged over-the-counter (OTC) derivatives, such as Contracts for Difference (CFDs) and spot forex, may result in losses exceeding initial deposits and may not be suitable for all investors. These complex instruments do not confer ownership of the underlying assets. Investors should carefully consider their investment objectives and risk appetite, and seek independent professional advice if necessary.
Century Financial Consultancy LLC (CFC) is licensed and regulated by the Securities and Commodities Authority (SCA) of the UAE under license numbers 20200000028 and 301044 to carry out the activities of Trading Broker in international markets, Trading Broker of OTC derivatives and currencies in the spot market, Introduction, Financial Consultations, and Promotion. CFC is incorporated under UAE law, registered with the Dubai Economic Department (No. 768189), with its office at 601, Level 6, Building No. 4, Emaar Square, Downtown Dubai, UAE, PO Box 65777.
The content on this website is provided solely for informational and educational purposes and does not constitute an offer, recommendation, or solicitation to buy or sell any securities or financial products.
Products and services offered by CFC are not intended for use in any jurisdiction where such use or distribution would breach local laws or regulatory requirements.
Alert: Fraudulent Activity Notice
Century Financial Consultancy LLC (“Century”) has become aware of fraudulent individuals and entities impersonating our firm through unofficial websites, social media channels, and messaging applications such as Telegram, WhatsApp, and Discord.
Please be advised:
- Century does not manage investments on behalf of clients.
- Century does not solicit funds or guarantee investment returns.
- Century does not accept or make payments in cash, cryptocurrency, or digital assets.
- We do not conduct business via social media or messaging platforms.
Our only official website is www.century.ae, and all communication is conducted exclusively through verified channels.
We strongly urge the public to remain vigilant, verify the authenticity of any communication claiming to be from Century, and report any suspicious activity. Century disclaims any responsibility for losses arising from dealings with unauthorised or fraudulent parties.
