

Ever noticed a candlestick that looks like a hammer at the bottom of a downtrend? Don’t ignore it—it could be your signal to enter a potentially profitable trade. The hammer candlestick is a powerful bullish reversal pattern that signals the end of a downtrend and the beginning of a possible rally. Whether you trade stocks , forex , crypto, or commodities , recognizing and confirming this pattern can improve your trade timing significantly.
In this guide, we’ll explore what a hammer candlestick is, how it works, how to trade it, and how it compares with other similar patterns like the inverted hammer and hanging man. Plus, we’ll discuss trading psychology, confirmation strategies, and key technical indicators to boost your accuracy.
What Exactly Is a Hammer Candlestick?
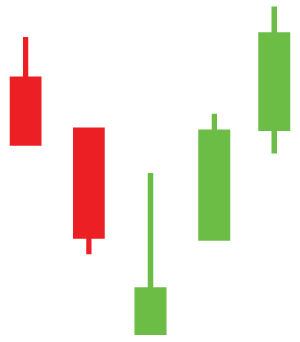
Imagine a candlestick with a tiny body sitting near the top and a long tail stretching down below - that’s your classic hammer. It usually forms after a price has been falling for a while, signaling that sellers pushed the price down hard during the session, but buyers came rushing in and pushed it back up near the opening price by the close.
.png)
Here’s the key:
Why the Hammer Candlestick Pattern Matters
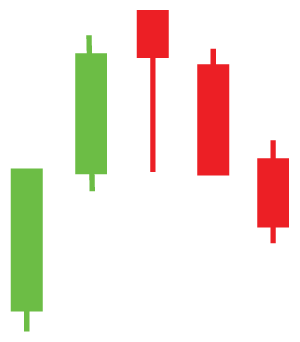
The hammer tells a visual story of a market tug-of-war. Sellers dominated early in the session, but buyers came in aggressively and pushed the price back up near the opening level. This sudden shift in control often hints that bearish momentum is weakening.
If you spot a hammer near a known support level, its strength increases. Market participants interpret this as buyers stepping in to defend that level, suggesting the potential start of a new uptrend.
The Psychology Behind the Hammer
Trading isn’t just numbers—it’s emotion, crowd behavior, and momentum. The hammer represents a clear rejection of lower prices. Bears try to push the market down, but bulls push it right back up. This creates a bullish psychological tone, especially if the candle closes green
Context is key: if the hammer appears after a prolonged decline or near technical support, it signals exhaustion in selling pressure and readiness for a reversal.
.jpg)
Hammer vs. Its Close Relatives:
Inverted Hammer and Hanging Man
Let’s break down how the hammer compares with two similar-looking candlesticks:
Inverted Hammer:
This appears after a downtrend but looks like an upside-down hammer. It has a small body at the bottom and a long upper shadow. It shows buyers attempted a reversal but failed to hold higher prices. A strong confirmation is critical.
Hanging Man:
Visually identical to a hammer but forms after an uptrend. It warns of a potential top or trend reversal. The long lower wick shows selling pressure, but since it occurs at the top, it’s considered a bearish signal.
How to Identify and Trade the Hammer Candlestick Pattern
1. Spot the Hammer
Confirm the candle appears after a downtrend, has a small upper body near the top, and a long lower wick (2x the body).
2. Wait for Confirmation
Look for a bullish confirmation candle closing above the hammer’s high. Combine with rising volume, RSI, or MACD for stronger signals.
3. Enter the Trade
Enter at the close of the confirmation candle or after a break above the hammer’s high.
4. Set a Stop-Loss
Place your stop just below the hammer’s low. Give it room to avoid getting stopped out by minor volatility.
5. Plan Your Profit Target
Aim for a resistance level, swing high, or Fibonacci level. Maintain a minimum 1.5:1 risk-reward ratio.
Using Indicators to Boost Your Hammer Trades
Complement the pattern with these tools:
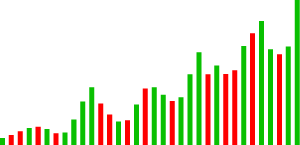
Volume:
Look for a spike on the hammer or confirmation candle.
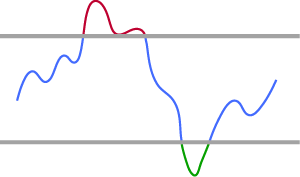
RSI (Relative Strength Index):
Oversold conditions turning up signal strength
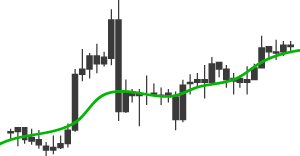
Moving Averages:
Look for hammers near 50-day or 200-day lines.
MACD:
Bullish crossovers add confluence.
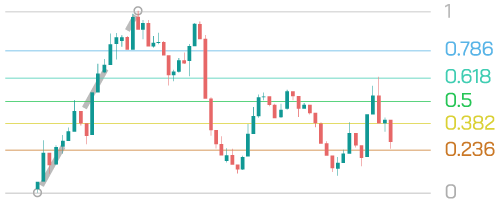
Fibonacci or S/R Zones
Increases reliability when hammers align with these.
Real-World Example of a Hammer Trade
Imagine a stock falling from $100 to $80 over two weeks. On day 10, you spot a hammer: it opens at $81, drops to $78, then closes at $80.80. The next day, it opens higher and closes at $83, confirming the pattern
You:
Tips to Improve Your Hammer Pattern Trading
FAQs on Hammer Candlestick Pattern
Q1: Can a red hammer still signal a reversal?
A: Yes. Red hammers still show rejection of lower prices but may require stronger confirmation.
Q2: Which timeframes are best for hammer patterns?
A: Works well across daily, 4-hour, and even 1-hour charts. Avoid very small timeframes due to noise.
Q3: Are hammer candles reliable alone?
A: No. Always combine with trend analysis and confirmation from the next candle or indicators
Conclusion: Nail Market Reversals with the Hammer Candlestick
The hammer candlestick pattern is more than just a shape—it’s a market signal backed by emotion, psychology, and price action. When confirmed with volume and indicators, it becomes a valuable tool for spotting reversals early. Practice spotting real hammers, confirm with solid setups, and always follow your risk management rules. With time, you’ll sharpen your trading instincts and gain confidence using this powerful price pattern.
This marketing and educational content has been created by Century Financial Consultancy LLC (“Century”) for general information only. It does not constitute investment, legal, tax, or other professional advice, nor does it constitute a recommendation, offer, or solicitation to buy or sell any financial instrument. The material does not take into account your investment objectives, financial situation, or particular needs.
The opinions expressed by the hosts, speakers, or guests are their own and may change without notice. Information is based on sources we consider to be reliable; however, Century does not guarantee its accuracy, completeness, or timeliness and accepts no liability for any loss arising from reliance on this content.
Trading and investing involve significant risk, and losses may exceed initial deposits. Past performance is not indicative of future results. CFDs and other leveraged products are complex instruments that may not be suitable for all investors. Please ensure you understand how these products work, the associated risks, and seek independent professional advice if necessary.
Century is licensed and regulated by the UAE Capital Market Authority (CMA) under License Nos. 20200000028 and 301044.
Please refer to the full risk disclosure mentioned on our website.


Regulated by CMA
Century Financial Consultancy LLC


.png)
.png)
.png)
.png)


Reach us:
-
Dubai
6th Floor, Emaar Square Building 4,
Downtown, Dubai, P.O. Box 65777,
Dubai, United Arab Emirates -
Abu Dhabi
27th Floor, Office 2701,
Shining Towers, Abu Dhabi, UAE -
Sharjah
29th Floor, Office 2905,
The Business Tower, Sharjah, UAE - +971 (4) 356 2800
- info@century.ae

Disclaimer: Trading in financial products carries substantial risk. Leveraged over-the-counter (OTC) derivatives, such as Contracts for Difference (CFDs) and spot forex, may result in losses exceeding initial deposits and may not be suitable for all investors. These complex instruments do not confer ownership of the underlying assets. Investors should carefully consider their investment objectives and risk appetite, and seek independent professional advice if necessary.
Century Financial Consultancy LLC (CFC) is licensed and regulated by the Capital Market Authority (CMA) of the UAE under license numbers 20200000028 and 301044 to carry out the activities of Financial Products dealer, Trading Broker in international markets, Trading Broker of OTC derivatives and currencies in the spot market, Introduction, Financial Consultations, and Promotion. CFC is incorporated under UAE law, registered with the Dubai Economic Department (No. 768189), with its office at 601, Level 6, Building No. 4, Emaar Square, Downtown Dubai, UAE, PO Box 65777.
The content on this website is provided solely for informational and educational purposes and does not constitute an offer, recommendation, or solicitation to buy or sell any securities or financial products.
Products and services offered by CFC are not intended for use in any jurisdiction where such use or distribution would breach local laws or regulatory requirements.
⚠️ Alert: Fraudulent Activity Notice
Century Financial Consultancy LLC (“Century”) has become aware of fraudulent individuals and entities impersonating our firm through unofficial websites, social media channels, and messaging applications such as Telegram, WhatsApp, and Discord.
Please be advised:
- Century does not manage investments on behalf of clients.
- Century does not solicit funds or guarantee investment returns.
- Century does not accept or make payments in cash, cryptocurrency, or digital assets.
- We do not conduct business via social media or messaging platforms.
Our only official website is www.century.ae, and all communication is conducted exclusively through verified channels.
We strongly urge the public to remain vigilant, verify the authenticity of any communication claiming to be from Century, and report any suspicious activity. Century disclaims any responsibility for losses arising from dealings with unauthorised or fraudulent parties.
