In this article, you will learn the basics of swing trading strategies and gain valuable insights into five of the most popular swing trading techniques and strategies commonly utilized by traders. This guide covers an example that illustrates how to swing trade stocks using a Fibonacci retracement and guides you into identifying your swing trading entry and exit points.
What is swing trading?
Swing trading is a trading strategy that focuses on profiting off changing trends in price action over relatively short timeframes. Swing traders will try to capture upswings and downswings in stock prices. Positions are typically held for one to six days, although some may last as long as a few weeks if the trade remains profitable. Traders who swing trade stocks find trading opportunities using a variety of technical indicators to identify patterns, trend direction and potential short-term changes in trend.
Swing trading example
There are numerous strategies you can use to swing-trade stocks. In this example we've shown a swing trade based on trading signals produced using a Fibonacci retracement. The three most important points on the chart used in this example include the trade entry point (A), exit level (C) and stop loss (B). Any swing trading system should include these three key elements.
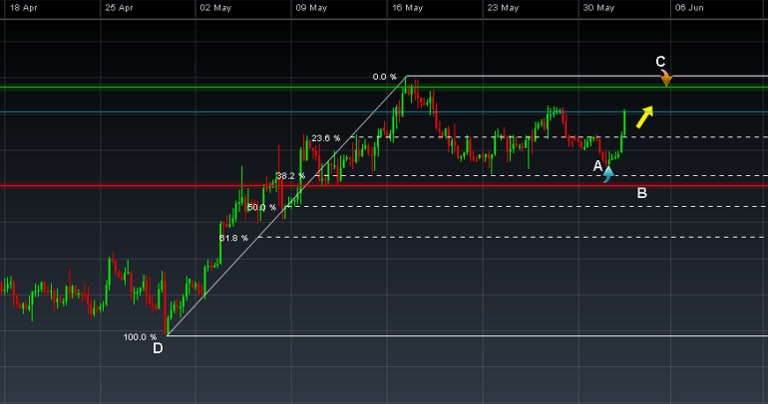
Guide to diagram:
A – Trade entry point B – Stop loss
C – Price forecast (exit level)
D – Fibonacci technical analysis
The stop loss level and exit point don't have to remain at a set price level as they will be triggered when a certain technical set-up occurs, and this will depend on the type of swing trading strategy you are using. The estimated timeframe for this stock swing trade is approximately one week. It's important to be aware of the typical timeframe that swing trades unfold over so that you can effectively monitor your trades and maximise the potential for your trades to be profitable.
Five swing trading strategies for stocks
We've summarized five swing trade strategies below that you can use to identify trading opportunities and manage your trades from start to finish. Apply these swing trading techniques to the stocks you're most interested in to look for possible trade entry points. You can also use tools such as pattern recognition scanner to help you identify stocks that are showing potential technical trading signals.
1 – Fibonacci retracement
The Fibonacci retracement pattern can be used to help traders identify support and resistance levels, and therefore possible reversal levels on stock charts. Stocks often tend to retrace a certain percentage within a trend before reversing again, and plotting horizontal lines at the classic Fibonacci ratios of 23.6%, 38.2% and 61.8% on a stock chart can reveal potential reversal levels. Traders often look at the 50% level as well, even though it does not fit the Fibonacci pattern, because stocks tend to reverse after retracing half of the previous move.
A stock swing trader could enter a short-term sell position if price in a downtrend retraces to and bounces off the 61.8% retracement level (acting as a resistance level), with the aim to exit the sell position for a profit when price drops down to and bounces off the 23.6% Fibonacci line (acting as a support level).
2 – Support and resistance triggers
Support and resistance lines represent the cornerstone of technical analysis and you can build a successful stock swing trading strategy around them.
A support level indicates a price level or area on the chart below the current market price where buying is strong enough to overcome selling pressure. As a result, a decline in price is halted and price turns back up again. A stock swing trader would look to enter a buy trade on the bounce off the support line, placing a stop loss below the support line.
Resistance is the opposite of support. It represents a price level or area above the current market price where selling pressure may overcome buying pressure, causing the price to turn back down against an uptrend. In this case a swing trader could enter a sell position on the bounce off the resistance level, placing a stop loss above the resistance line. A key thing to remember when it comes to incorporating support and resistance into your swing trading system is that when price breaches a support or resistance level, they switch roles – what was once a support becomes a resistance, and vice versa.
3 – Channel trading
This swing trading strategy requires that you identify a stock that's displaying a strong trend and is trading within a channel. If you have plotted a channel around a bearish trend on a stock chart, you would consider opening a sell position when the price bounces down off the top line of the channel. When using channels to swing-trade stocks it's important to trade with the trend, so in this example where the price is in a downtrend, you would only look for sell positions – unless price breaks out of the channel, moving higher and indicating a reversal and the beginning of an uptrend.
4 – 10- and 20-day SMA
Another of the most popular swing trading strategies involves the use of simple moving averages (SMAs). SMAs smooth out price data by calculating a constantly updating average price which can be taken over a range of specific time periods, or lengths. For example, a 10-day SMA adds up the daily closing prices for the last 10 days and divides by 10 to calculate a new average each day. Each average is connected to the next to create a smooth line which helps to cut out the 'noise' on a stock chart. The length used (10 in this case) can be applied to any chart interval, from one minute to weekly. SMAs with short lengths react more quickly to price changes than those with longer timeframes.
With the 10- and 20-day SMA swing trading system you apply two SMAs of these lengths to your stock chart. When the shorter SMA (10) crosses above the longer SMA (20) a buy signal is generated as this indicates that an upswing is in progress. When the shorter SMA crosses below the longer-term SMA, a sell signal is generated as this type of SMA crossover indicates a downwards swing.
5 – MACD crossover
The MACD crossover swing trading system provides a simple way to identify opportunities to swing-trade stocks. It's one of the most popular swing trading indicators used to determine trend direction and reversals. The MACD consists of two moving averages – the MACD line and signal line – and buy and sell signals are generated when these two lines cross. If the MACD line crosses above the signal line a bullish trend is indicated, and you would consider entering a buy trade. If the MACD line crosses below the signal line a bearish trend is likely, suggesting a sell trade. A stock swing trader would then wait for the two lines to cross again, creating a signal for a trade in the opposite direction, before they exit the trade.
The MACD oscillates around a zero line and trade signals are also generated when the MACD crosses above the zero line (buy signal) or below it (sell signal).
How to swing trade stocks
Research markets using technical analysis: Utilizing tools such as our pattern recognition scanner, you can spot trend reversals and other price signals to help inform your swing trading efforts.
Choose an asset to swing trade: Once you have undertaken your research, decide which asset and time frame you wish to swing trade. Also, determine your entry and exit strategy based off your swing trading signal. For example, to buy AAPL when the price hits the support level.
Use risk management conditions: Include a stop loss and take profit order to mitigate any risks. These risk management tools help keep your trades consistent and relevant to your trading strategy.
Monitor your position: Keep an eye on your trade whilst it is open. Be aware of gapping and slippage, and changes within the market’s sentiment.
Exit trade: If the trade has not been exited by your stop loss, close the trade as per your swing trading strategy.
Finding stocks to swing trade
When swing trading stocks it is essential to choose the right assets to trade, as bad market selection could be a major weakness in your trading strategy. Make use of these tips to enhance your market selection efforts.
Make use of chart patterns: Use our pattern recognition scanner that can help you identify reversal patterns like a double top or triple top chart pattern.
Monitor the economic calendar: Keep an eye on the economic calendar, which can help you determine the health of a nation’s economy, and potential trading opportunities or risks in the future.
Factor in earning calendars: Earning calendars will help you factor in sudden price movements to your swing trading strategies.
Be careful when trading penny stocks: Penny stocks are highly speculative investments, so take care when trading them. Although the volatility of the penny stock markets presents high-growth trading opportunities, it also presents larger risks.
Summary
All of these strategies can be applied to your future trades to help you identify swing trading opportunities in the markets you're most interested in.
Source: CMC Markets UK
Disclaimer: Century Financial Consultancy LLC (“CFC”) is Limited Liability Company incorporated under the Laws of UAE and is duly licensed and regulated by the Emirates Securities and Commodities Authority of UAE (SCA). This document is a marketing material and is for informational purposes only and must not be construed to be an advice to invest or otherwise in any investment or financial product. CFC does not guarantee as to adequacy, accuracy, completeness or reliability of any information or data contained herein and under no circumstances whatsoever none of such information or data be construed as an advice or trading strategy or recommendation to deal (Buy/Sell) in any investment or financial product. CFC is not responsible or liable for any result, gain or loss, based on this information, in whole or in part.
PLEASE READ THE FOLLOWING TERMS AND CONDITIONS OF ACCESS FOR THE PUBLICATION BEFORE THE USE THEREOF.
By use of the publication and continuing to access the publication, you accept these terms and conditions and undertake to be bound by the acceptance. CFC reserves the right to amend, remove, or add to the publication and Disclaimer at any time without any prior notice to you. Such modifications shall be effective immediately. Accordingly, please continue to review this Disclaimer whenever accessing, or using the publication. Your access of, and use of the publication, after modifications to the Disclaimer will constitute your acceptance of the terms and conditions of use of the publication, as modified. If, at any time, you do not wish to accept the content of this Disclaimer, you may not access, or use the publication. Any terms and conditions proposed by you which are in addition to or which conflict with this Disclaimer are expressly rejected by CFC and shall be of no force or effect.
No information as given herein by CFC in this publication should be construed as an offer, recommendation or solicitation to purchase or dispose of any securities/financial instruments/products or to enter in any transaction or adopt any hedging, trading or investment strategy. Neither this publication nor anything contained herein shall form the basis of any contract or commitment whatsoever. Distribution of this publication does not oblige CFC to enter into any transaction.
The content of this publication should not be considered legal, regulatory, credit, tax or accounting advice. Anyone proposing to rely on or use the information contained in the publication should independently verify and check the accuracy, completeness, reliability and suitability of the information and should obtain independent and specific advice from appropriate professionals or experts regarding information contained in this publication. CFC cannot be held responsible for the impact of any transactional costs or any taxes as may be applicable on transactions.
Information contained herein is based on various sources, including but not limited to public information, annual reports and statistical data that CFC considers reliable. However, CFC makes no representation or warranty as to the accuracy or completeness of any report or statistical data made in or in connection with this publication and accepts no responsibility whatsoever for any loss or damage caused by any act or omission taken as a result of the information contained in this publication. The articles does not take into account the investment objectives, financial situations and specific needs of recipients. The recipient of this publication must make its own independent decisions regarding whether this communication and any securities or financial instruments mentioned herein, is appropriate in the light of its existing portfolio holdings and/or investment needs.
This document is a marketing material and has been prepared by individual(s), marketing and/or research personnel of CFC. It has not been prepared in accordance with legal requirements designed to promote the independence of investment research and as such is purely a marketing communication. In this publication, any opinions, news, research, analysis, prices, or other information constitute is a general market commentary, and do not constitute the opinion or advice of CFC or any form of personal or investment advice. CFC neither endorses nor guarantees offerings of third party, nor is CFC responsible for the content, veracity or opinions of third-party speakers, presenters, participants or providers. CFC will not accept liability for any loss or damage, including without limitation to, any loss of profit, which may arise directly or indirectly from use of or reliance on such information.
Charts, graphs and related data or information provided in this publication are intended to serve for illustrative purposes only. The information contained in this publication is prepared as of a particular date and time and will not reflect subsequent changes in the market or changes in any other factors relevant to their determination. All statements as to future matters are not guaranteed to be accurate. CFC expressly disclaims any obligation to update or revise any forward-looking statements to reflect new information, events or circumstances after the date of this publication or to reflect the occurrence of unanticipated events.
Staff members/employees of CFC may provide/present oral or written market commentary or analysis to you that reflect opinions that are contrary to the opinions expressed in this research and may contain insights and reports that are inconsistent with the views expressed in this publication. Neither CFC nor any of its affiliates, group companies, directors, employees, agents or representatives assume any liability nor shall they be made liable for any damages whether direct, indirect, special or consequential including loss of revenue or profits that may arise from or in connection with the use of the information provided in this publication.
Information or data provided by means in this publication may have many inherent limitations, like module errors or lack accuracy in its historical data. Data included in the publication may rely on models that do not reflect or take into account all potentially significant factors such as market risk, liquidity risk, credit risk etc.
The use of our information, products and services should be on your own due diligence and you agree that CFC is not liable for any failure to achieve desired return on investment that is in any manner related to availing of services or products of CFC and use of our information, products and services. You acknowledge and agree that past investment performance is not indicative of the future performance results of any investment and that the information contained herein is not to be used as an indication for the future performance of any investment activity.
This publication is being furnished to you solely for your information and neither it nor any part of it may be used, forwarded, disclosed, distributed or delivered to anyone else. You may not copy, reproduce, display, modify or create derivative works from any data or information contained in this publication.
Services offered by CFC include products that are traded on margin and can result in losses that exceed deposits. Before deciding to trade on margin products, you should consider your investment objectives, risk tolerance and your level of experience on these products. Trading with leverage carries significant risk of losses and as such margin products are not suitable for every investor and you should ensure that you understand the risks involved and should seek independent advice from professionals or experts if necessary.
Ready to Invest?
Explore a new trading experience with
Century Trader App
Losses can exceed your deposits
Ready to Invest?
Explore a new trading experience with
Century Trader App
Losses can exceed your deposits

Regulated by CMA
Century Financial Consultancy LLC


.png)
.png)
.png)
.png)
.png)

Reach us:
-
Dubai
6th Floor, Emaar Square Building 4,
Downtown, Dubai, P.O. Box 65777,
Dubai, United Arab Emirates -
Abu Dhabi
27th Floor, Office 2701,
Shining Towers, Abu Dhabi, UAE -
Sharjah
29th Floor, Office 2905,
The Business Tower, Sharjah, UAE - +971 (4) 356 2800
- info@century.ae

Disclaimer: Trading in financial products carries substantial risk. Leveraged over-the-counter (OTC) derivatives, such as Contracts for Difference (CFDs) and spot forex, may result in losses exceeding initial deposits and may not be suitable for all investors. These complex instruments do not confer ownership of the underlying assets. Investors should carefully consider their investment objectives and risk appetite, and seek independent professional advice if necessary.
Century Financial Consultancy LLC (CFC) is licensed and regulated by the Capital Market Authority (CMA) of the UAE under license numbers 20200000028 and 301044 to carry out the activities of Financial Products dealer, Trading Broker in international markets, Trading Broker of OTC derivatives and currencies in the spot market, Introduction, Financial Consultations, and Promotion. CFC is incorporated under UAE law, registered with the Dubai Economic Department (No. 768189), with its office at 601, Level 6, Building No. 4, Emaar Square, Downtown Dubai, UAE, PO Box 65777.
The content on this website is provided solely for informational and educational purposes and does not constitute an offer, recommendation, or solicitation to buy or sell any securities or financial products.
Products and services offered by CFC are not intended for use in any jurisdiction where such use or distribution would breach local laws or regulatory requirements.
⚠️ Alert: Fraudulent Activity Notice
Century Financial Consultancy LLC (“Century”) has become aware of fraudulent individuals and entities impersonating our firm through unofficial websites, social media channels, and messaging applications such as Telegram, WhatsApp, and Discord.
Please be advised:
- Century does not manage investments on behalf of clients.
- Century does not solicit funds or guarantee investment returns.
- Century does not accept or make payments in cash, cryptocurrency, or digital assets.
- We do not conduct business via social media or messaging platforms.
Our only official website is www.century.ae, and all communication is conducted exclusively through verified channels.
We strongly urge the public to remain vigilant, verify the authenticity of any communication claiming to be from Century, and report any suspicious activity. Century disclaims any responsibility for losses arising from dealings with unauthorised or fraudulent parties.
