Friday, September 05, 2025
China's Investment case - Stimulus, AI and Value
By Century Financial in 'Investment Insights'
.jpg)
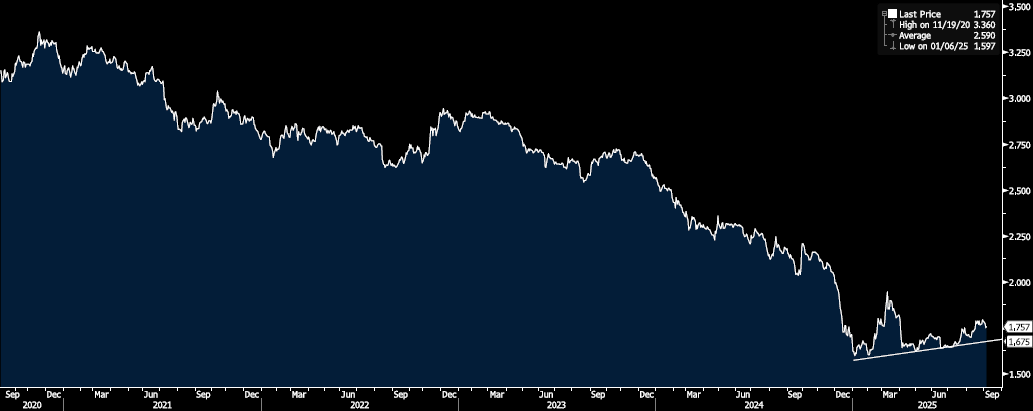
Aggressive stimulus and fiscal support - At the start of 2025, Beijing announced the issuance of 3 trillion yuan in government bonds to boost business investment and household consumption. This policy support helped China’s economy expand by 5.3% in the first half of 2025, even amid rising external pressures. However, in July and August, the economy slowed down, which raised expectations for Beijing to roll out more stimulus this year to offset the impact of Donald Trump’s trade war.
Signs of fiscal activity are already visible as China’s 10-year bond yields have steadied since January, reflecting heavier bond issuance and sustained government financing efforts.
China 10 year bond yield
PBOC financing support and liquidity boost – Following the release of soft economic data in July, the People’s Bank of China pledged to step up financial support for priority sectors, including technology and consumption. This marks a shift away from its traditional focus on channeling credit to property and infrastructure, signaling a more targeted, innovation-driven approach to sustaining growth and stabilizing demand
Leadership in AI and Advanced Technology - China’s strategic ambitions in AI have accelerated in the wake of DeepSeek’s breakthrough launch, with momentum expected to build over the next 24 months. Despite ongoing semiconductor supply constraints, China is steadily narrowing its gap with the U.S., leveraging its strengths in software development and applied AI to emerge as a leading challenger in the field worldwide. According to the Financial Times, Chinese chipmakers plan to triple AI chip output by 2026, thereby reducing their reliance on Nvidia and strengthening domestic supply chains.
Investor sentiment is aligning with this trend: in the week ending August 31, China-focused AI, tech, and fintech ETFs led global inflows and returns, supported by government stabilization measures and expectations of surging demand for locally produced chips that power the AI and EV industries.
A key enabler of this growth is China’s dominance in electricity. Unlike the U.S., where an aging grid is constraining AI infrastructure, China benefits from a robust and expanding power network. As highlighted by Ember, China has nearly doubled its share of primary energy since 2000 to almost 25%, while the U.S. has remained stagnant—underscoring a structural edge in scaling AI capacity.
Domestic consumption revival – In H1 2025, consumption-related fiscal spending outpaced overall expenditure growth, with targeted subsidies for smartphones and home appliances expected to lift retail sales through the second half of the year. On August 12, authorities introduced a new consumer loan program, effective September 1, that offers subsidized borrowing through August 2026 for automobiles, electronics, and essential services, including elderly care, child care, education, and tourism. This initiative builds on earlier stimulus efforts and is designed to support large-ticket purchases while broadening demand in the service sector. Looking ahead, the PBOC is expected to ease monetary policy further, following weak July activity and credit data, which will provide additional tailwinds for household spending.
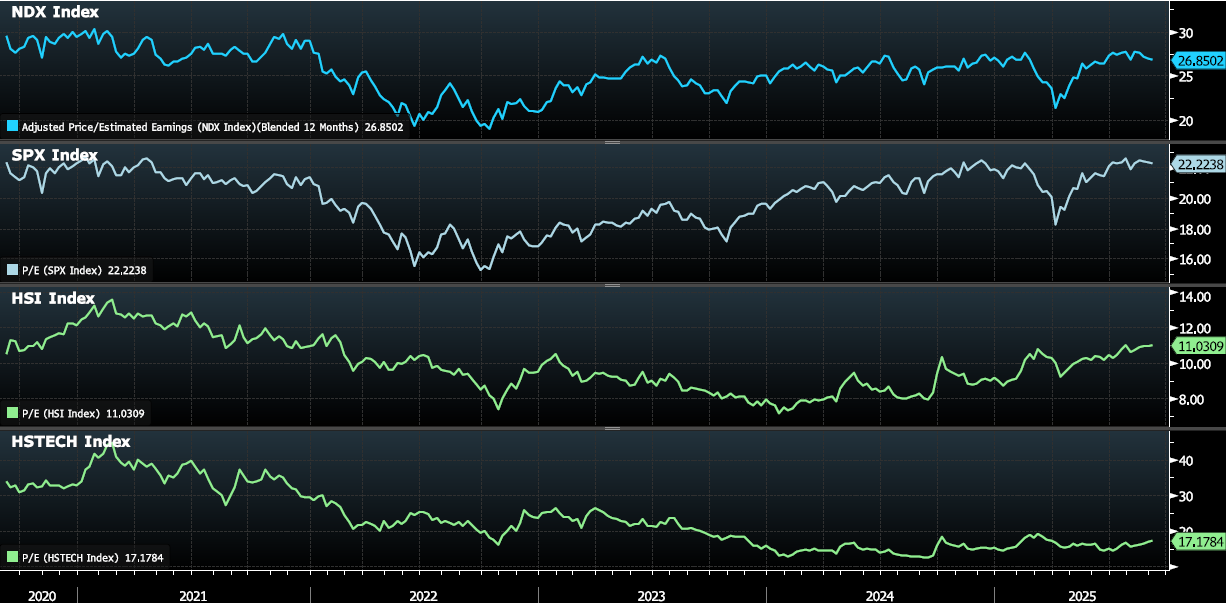
Attractive Valuations – With concerns over stretched valuations in U.S. tech, investors are increasingly rotating into Chinese tech stocks. Alibaba’s recent earnings beat highlighted this trend, with stronger cloud sales and a revival in e-commerce drawing renewed attention from global funds. A softer U.S. dollar is further reducing the appeal of dollar-denominated assets, encouraging diversification into Asia. Valuation gaps remain compelling: while the S&P 500 and Nasdaq trade at forward P/Es above 20, the Hang Seng and Hang Seng Tech Index continue to sit well below that threshold, offering investors both growth exposure and relative value.
Technicals
Hang Seng Index (HK50)
(1).png)
Source: Trading View
Timeframe: Weekly
Date: 2nd September 2025
- The Hang Seng Index trades at HKD 25,343 and has already broken out of the 2022 resistance at HKD 24,210.
- It is currently trading in an ascending parallel channel on the weekly timeframe.
- The index trades below the HKD 30,000 touched in 2021, and faces a near-term resistance and support at HKD 27,000 and HKD 24,210, respectively.
The following two ETFs listed in US give specific exposure to China Technology and AI-related stocks.
KraneShares CSI China Internet ETF (KWEB)
.png)
Source: Trading View
Timeframe: Weekly
Date: 2nd September 2025
- The ETF is testing the 2022 resistance and has formed a three-year base.
- A breakout from this level can push it towards the next resistance at $54
- The pattern gets invalidated below $30, which coincides with the ascending trendline support.
Invesco China Technology ETF (CQQQ)
.png)
Source: Trading View
Timeframe: Weekly
Date: 2nd September 2025
- The ETF has broken out of the 2022 resistance at $51.44 and is restesting the same level. It can potentially test the next resistance at $74.29.
- The high volumes in the recent months reflect the optimism around stimulus and smart money building positions.
- On the contrary, the chart gets invalidated below $36.
Risks and Assumptions related to Back-tested trading strategies
Disclaimer:Century Financial Consultancy LLC (CFC) is licensed and regulated by the Securities and Commodities Authority (SCA) of the UAE under license numbers 20200000028 and 301044 to carry out the activities of Trading Broker in international markets, Trading Broker of OTC derivatives and currencies in the spot market, Introduction, Financial Consultations, and Promotion. CFC is incorporated under UAE law, registered with the Dubai Economic Department (No. 768189), with its offce at 601, Level 6, Building No. 4, Emaar Square, Downtown Dubai, UAE, PO Box 65777.
Terms and Conditions of Access
By accessing and continuing to use the Publication (which includes this document, flyer, charts, diagrams, illustrations, images, calculations, scenario analysis, and related data or content), you confirm that you have read, understood, and agreed to the terms of this Disclaimer.
CFC reserves the right to amend or update the Publication and this Disclaimer at any time without prior notice. Continued use following any such update constitutes your acceptance of the revised terms. If you do not agree with these terms, please discontinue use of the Publication.
Purpose and Intended Use
This Publication is classified as marketing material and should not be regarded as independent investment research. It is provided for informational, educational, and illustrative purposes only and does not constitute investment advice, a recommendation, an offer, or a solicitation to buy or sell any financial instruments or services. All views expressed are general market commentary and may not reflect the opinions of CFC as a whole.
Risk Disclosures and Limitations
The information presented does not cover all the risks associated with the products or scenarios discussed. Please refer to the full Risk Disclosure Statement available on our website.
This Publication reflects information available at the time of preparation and does not account for subsequent developments. Any forward-looking statements involve assumptions and uncertainties; actual outcomes may differ materially. CFC does not guarantee the accuracy, completeness, or reliability of the information and disclaims liability for any action taken based on it.
No Offer or Contractual Commitment
No part of this Publication constitutes an offer, agreement, or commitment to enter into any transaction. Distribution of this Publication does not oblige CFC to engage in any trade or provide any services. Product names or terms may differ across platforms or providers.
This material should not be interpreted as legal, regulatory, tax, accounting, or credit advice. Recipients should seek independent professional advice and assess their own financial situation, objectives, and risk profile before making investment decisions.
Data Sources and Interpretation
This Publication may rely on publicly available data, third-party information, or model-based assumptions. CFC makes no representation or warranty as to their accuracy or completeness. Data limitations, errors, or outdated inputs may impact the reliability of projections or scenarios. Names of financial products may differ from those used on trading platforms.
Use, Reproduction, and Analyst Disclosure
This Publication is intended solely for the recipient’s informational use. It may not be copied, transmitted, or distributed in any form, wholly or partially, without prior written permission from CFC.
Analyst Declaration: The Analyst(s) certifies that all opinions expressed in this Publication represent their own independent views and that reasonable care was taken to ensure objectivity. They do not hold securities in the companies mentioned, and their compensation is not linked to the views expressed. CFC’s research and marketing divisions operate independently.
Trading Risk Warning:
Trading in financial products involves significant risk. Leveraged OTC derivatives such as Contracts for Difference (CFDs) and spot forex contracts carry a high risk of loss, potentially exceeding initial deposits, and may not be suitable for all investors. These instruments do not confer ownership of underlying assets. Investors must carefully evaluate their investment objectives and risk tolerance, and consult independent advisors where appropriate.

Regulated by CMA
Century Financial Consultancy LLC


.png)
.png)
.png)
.png)


Reach us:
-
Dubai
6th Floor, Emaar Square Building 4,
Downtown, Dubai, P.O. Box 65777,
Dubai, United Arab Emirates -
Abu Dhabi
27th Floor, Office 2701,
Shining Towers, Abu Dhabi, UAE -
Sharjah
29th Floor, Office 2905,
The Business Tower, Sharjah, UAE - +971 (4) 356 2800
- info@century.ae

Disclaimer: Trading in financial products carries substantial risk. Leveraged over-the-counter (OTC) derivatives, such as Contracts for Difference (CFDs) and spot forex, may result in losses exceeding initial deposits and may not be suitable for all investors. These complex instruments do not confer ownership of the underlying assets. Investors should carefully consider their investment objectives and risk appetite, and seek independent professional advice if necessary.
Century Financial Consultancy LLC (CFC) is licensed and regulated by the Capital Market Authority (CMA) of the UAE under license numbers 20200000028 and 301044 to carry out the activities of Financial Products dealer, Trading Broker in international markets, Trading Broker of OTC derivatives and currencies in the spot market, Introduction, Financial Consultations, and Promotion. CFC is incorporated under UAE law, registered with the Dubai Economic Department (No. 768189), with its office at 601, Level 6, Building No. 4, Emaar Square, Downtown Dubai, UAE, PO Box 65777.
The content on this website is provided solely for informational and educational purposes and does not constitute an offer, recommendation, or solicitation to buy or sell any securities or financial products.
Products and services offered by CFC are not intended for use in any jurisdiction where such use or distribution would breach local laws or regulatory requirements.
⚠️ Alert: Fraudulent Activity Notice
Century Financial Consultancy LLC (“Century”) has become aware of fraudulent individuals and entities impersonating our firm through unofficial websites, social media channels, and messaging applications such as Telegram, WhatsApp, and Discord.
Please be advised:
- Century does not manage investments on behalf of clients.
- Century does not solicit funds or guarantee investment returns.
- Century does not accept or make payments in cash, cryptocurrency, or digital assets.
- We do not conduct business via social media or messaging platforms.
Our only official website is www.century.ae, and all communication is conducted exclusively through verified channels.
We strongly urge the public to remain vigilant, verify the authenticity of any communication claiming to be from Century, and report any suspicious activity. Century disclaims any responsibility for losses arising from dealings with unauthorised or fraudulent parties.
