Tuesday, March 10, 2026
Geopolitics in Focus: Trading the Disruption
By Century Financial in 'Investment Insights'

Foreword
The trades discussed in this report are related to the current market situation. They are intended to take advantage of short-term opportunities created by the ongoing U.S.–Israel conflict with Iran and the disruption to shipping through the Strait of Hormuz since February 28, 2026. These ideas are meant for near-term positioning and should not be seen as long-term investment recommendations.
The basic idea is that periods of conflict often create sharp, temporary price gaps between assets that benefit from the disruption and those that are adversely a ected. Markets usually correct these imbalances once the situation stabilises. When tensions ease, a ceasefire is announced, or key supply routes reopen, the reasoning behind these trades will likely disappear — and positions should be reassessed or closed.
For that reason, these strategies should be approached as short-term opportunities with clear risk controls rather than positions intended to be held through a full market cycle. Geopolitical developments can shift quickly. A single diplomatic breakthrough, the resumption of safe tanker passage through Hormuz, or an increase in oil supply from OPEC could reverse several of these trades at once.
Investors should size positions carefully, stay attentive to developments in the region, and review the full risk disclaimer provided at the end of this report.
Geopolitical Trading Themes
Long - Heating Oil Cash (HOIL) | Short - Gasoline Cash (GOIL)
Long - WTI Crude Oil Futures | Short - International Airlines Group (ICAG)
Long - Energy Select Sector SPDR ETF (XLE) | Short - VanEck Gold Miners ETF (GDX)
Long - iShares U.S. Insurance ETF (IAK) | Short - U.S. Global Jets ETF (JETS)
Note - These are ratio trades and the same dollar amount value should be entered on the long and short side.
Heating Oil vs. Gasoline — Refined Products Trade
Long - Heating Oil Cash (HOIL) | Short - Gasoline Cash (GOIL)
This is a pair trade to capitalise on the high holding costs opportunity within derivatives of Crude oil. The trade involves going long on Heating Oil (Cash) and going short on Gasoline (Cash). The holding costs from the transactions come to +36.03% and +67.20%, respectively, at the time of writing.
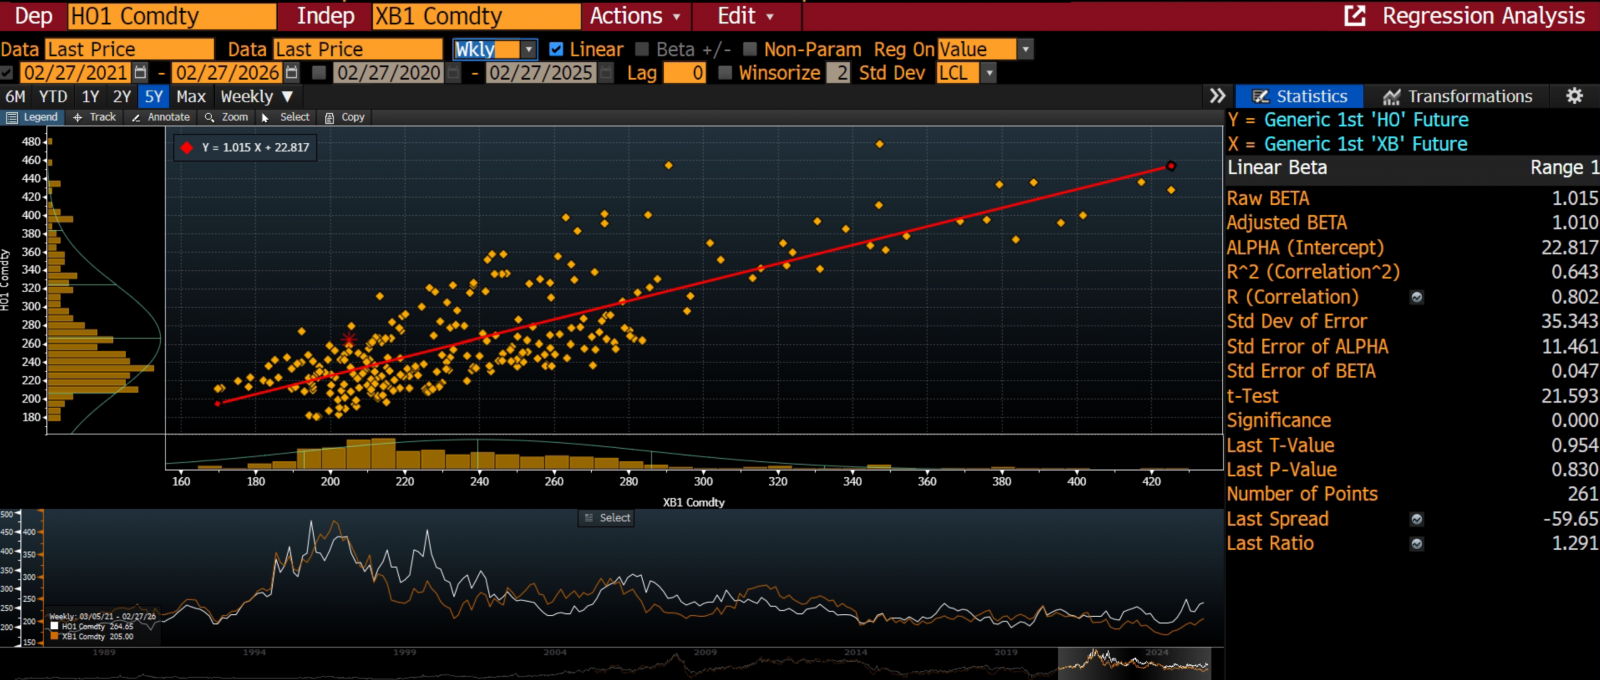
Heating Oil and Gasoline have witnessed a strong correlation of 0.802 in the past 5 years, suggesting the strong hedge one instrument can provide in relation to the other, making it an attractive pair trade idea.
Heating Oil/Gasoline Ratio
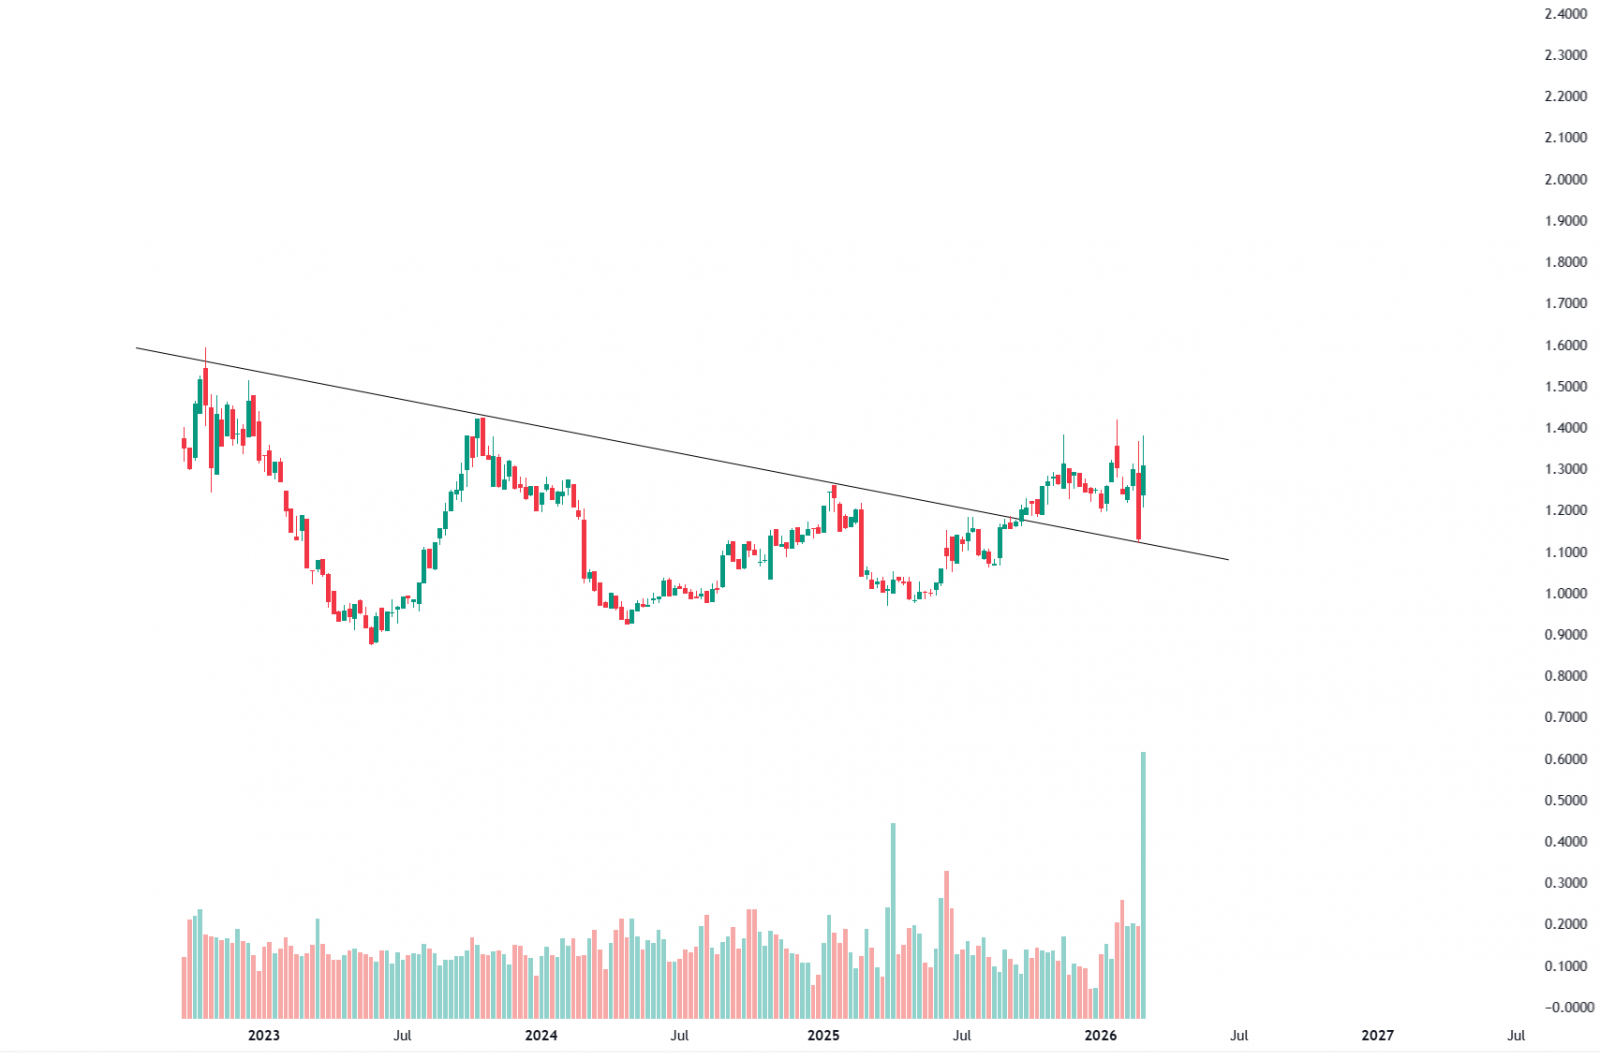
Additionally, the Heating Oil/Gasoline Ratio chart on the Weekly Timeframe has retested the breakout of a long-term trendline formed by connecting the highs of October 2022, October 2023, and January 2025, indicating a bullish market structure.
Crude Oil vs. International Airlines Group — Potential Energy Shock Mean Reversion
Long - WTI Crude Oil Futures | Short - International Airlines Group (ICAG)
Date: 6 March 2026
Source: Bloomberg
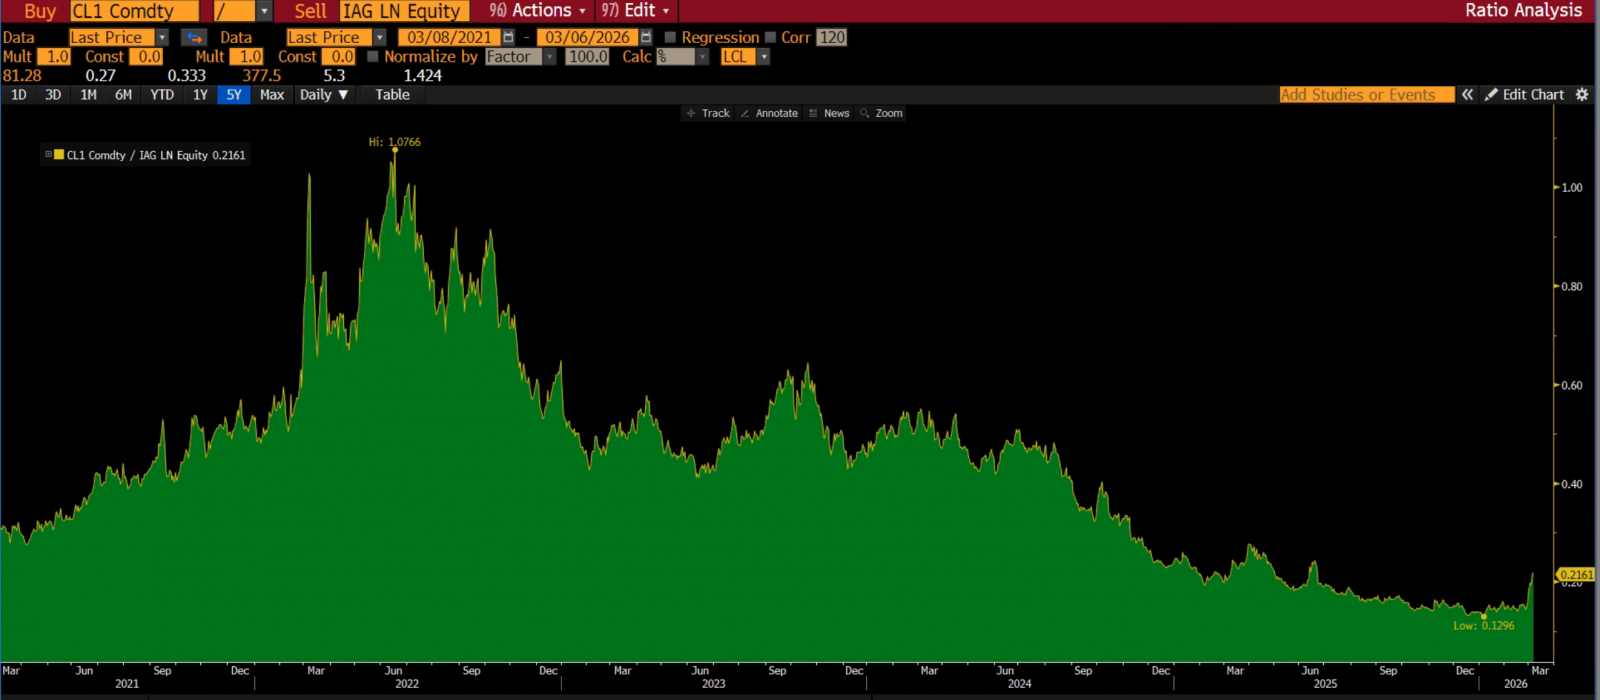
The WTI/ICAG ratio just bounced off a five-year low of 0.1296 and sits at 0.2161 today, still well below its 2023 average of 0.40–0.50 and a fraction of the 1.0766 peak hit during the Ukraine energy shock. The Hormuz crisis is the catalyst — the WTI Crude/ICAG ratio could push meaningfully higher on a sustained disruption while ICAG gets squeezed on both sides: surging jet fuel costs and forced rerouting of its London–Gulf and Asia routes around the Cape of Good Hope. ICAG, through British Airways, operates one of the heaviest schedules of London–Gulf and London–Asia long-haul routes among European carriers, making it the most directly exposed single-stock expression of this disruption. The key unpriced risk is that sell-side FY2026 estimates were built on $70–75 oil and normal operations — when ICAG management quantifies the damage, the short leg re-prices hard. Mean reversion to the 2023 average alone represents a roughly 2x move in the ratio from current levels. Stop loss on a clean break back below 0.1296.
U.S. Energy Producers vs. Gold Miners — Diverging Commodity Fortunes
Long - Energy Select Sector SPDR ETF (XLE) | Short - VanEck Gold Miners ETF (GDX)
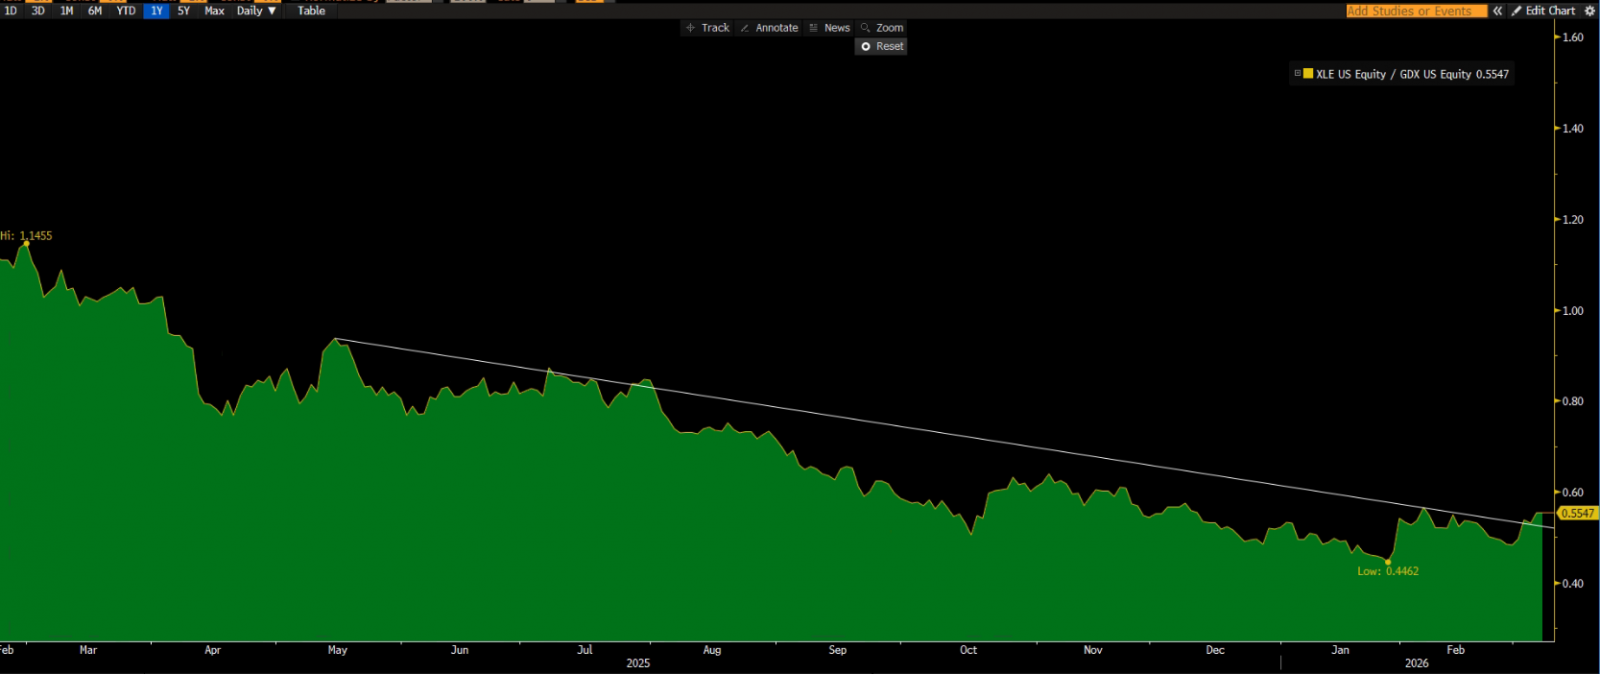
Date: 6 March 2026
Source: Bloomberg
Due to the US-Iran conflict in the Middle East, energy prices have surged. WTI oil has increased by nearly 20% this week. This benefits oil producers such as ExxonMobil and Chevron, which are major holdings in the ETF. Meanwhile, gold is on track to record its first weekly loss in nearly a month, as inflation risks and a stronger dollar serve as significant headwinds. For miners specifically, rising oil prices raise costs for fuel, transport, and operations. Since mining is energy-intensive, higher energy prices inflate production costs and reduce profit margins if commodity prices do not rise equally. Therefore, we expect miners to face challenges, while energy companies are likely to benefit if oil prices continue to climb. Technically, the ratio chart has shown a breakout of the trendline over the past few days. It currently stands at 0.55. The average of the ratio is around 0.72, implying the move has just started reverting to the mean.
U.S. Insurance vs. U.S. Airlines — A Geopolitical Divergence Play
Long - iShares U.S. Insurance ETF (IAK) | Short - U.S. Global Jets ETF (JETS)
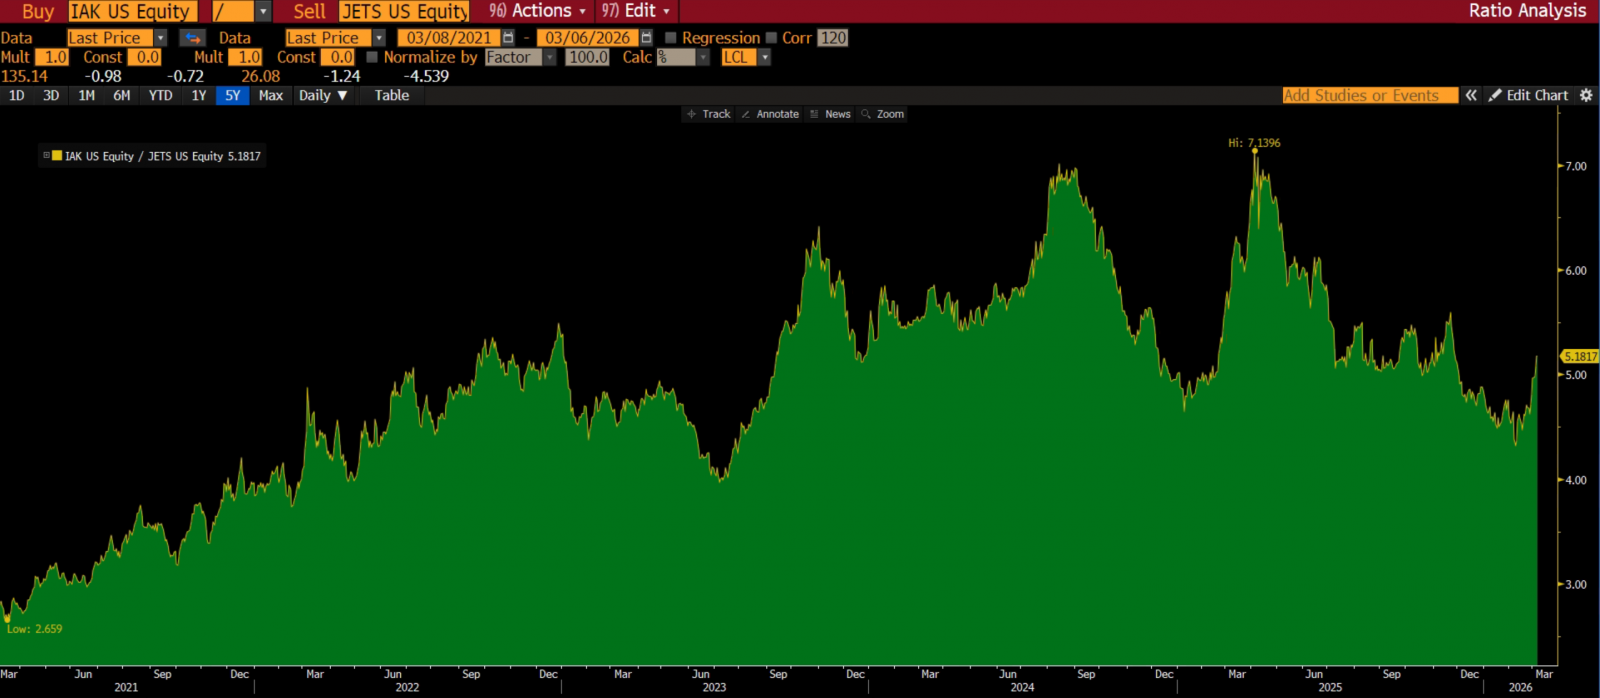
Date: 6 March 2026
Source: Bloomberg
The Middle East conflict is pushing insurance premiums higher while hurting airline economics. Shipping firms have started imposing war-risk surcharges: Mediterranean Shipping Company introduced new fees from 5 Mar 2026, ranging from $500 per 20-ft container and $1,000 for refrigerated units on some routes, and up to $2,000 (20-ft), $3,000 (40-ft) and $4,000 (reefer) on others due to security risks and disruptions near key routes such as the Strait of Hormuz. As insurers reprice marine and cargo risk and some war-risk coverage is withdrawn, insurance companies (captured by IAK) benefit from higher premiums and placement activity, while airlines (JETS) face higher jet-fuel costs, operational disruptions and weaker travel sentiment.
Risks and Assumptions related to Back-tested trading strategies
Disclaimer:Century Financial Consultancy LLC (CFC) is licensed and regulated by the Capital Market Authority (CMA) of the UAE under license numbers 20200000028 and 301044 to carry out the activities of Financial Products dealer, Trading Broker in international markets, Trading Broker of OTC derivatives and currencies in the spot market, Introduction, Financial Consultations, and Promotion. CFC is incorporated under UAE law, registered with the Dubai Economic Department (No. 768189), with its office at 601, Level 6, Building No. 4, Emaar Square, Downtown Dubai, UAE, PO Box 65777.
Terms and Conditions of Access
By accessing and continuing to use the Publication (which includes this document, flyer, charts, diagrams, illustrations, images, calculations, scenario analysis, and related data or content), you confirm that you have read, understood, and agreed to the terms of this Disclaimer.
CFC reserves the right to amend or update the Publication and this Disclaimer at any time without prior notice. Continued use following any such update constitutes your acceptance of the revised terms. If you do not agree with these terms, please discontinue use of the Publication.
Purpose and Intended Use
This Publication is classified as marketing material and should not be regarded as independent investment research. It is provided for informational, educational, and illustrative purposes only and does not constitute investment advice, a recommendation, an offer, or a solicitation to buy or sell any financial instruments or services. All views expressed are general market commentary and may not reflect the opinions of CFC as a whole.
Risk Disclosures and Limitations
The information presented does not cover all the risks associated with the products or scenarios discussed. Please refer to the full Risk Disclosure Statement available on our website.
This Publication reflects information available at the time of preparation and does not account for subsequent developments. Any forward-looking statements involve assumptions and uncertainties; actual outcomes may differ materially. CFC does not guarantee the accuracy, completeness, or reliability of the information and disclaims liability for any action taken based on it.
No Offer or Contractual Commitment
No part of this Publication constitutes an offer, agreement, or commitment to enter into any transaction. Distribution of this Publication does not oblige CFC to engage in any trade or provide any services. Product names or terms may differ across platforms or providers. This material should not be interpreted as legal, regulatory, tax, accounting, or credit advice. Recipients should seek independent professional advice and assess their own financial situation, objectives, and risk profile before making investment decisions.
Data Sources and Interpretation
This Publication may rely on publicly available data, third-party information, or model-based assumptions. CFC makes no representation or warranty as to their accuracy or completeness. Data limitations, errors, or outdated inputs may impact the reliability of projections or scenarios. Names of financial products may differ from those used on trading platforms.
Use, Reproduction, and Analyst Disclosure
This Publication is intended solely for the recipient’s informational use. It may not be copied, transmitted, or distributed in any form, wholly or partially, without prior written permission from CFC.
Analyst Declaration: The Analyst(s) certifies that all opinions expressed in this Publication represent their own independent views and that reasonable care was taken to ensure objectivity. They do not hold securities in the companies mentioned, and their compensation is not linked to the views expressed. CFC’s research and marketing divisions operate independently.
Trading Risk Warning:
Trading in financial products involves significant risk. Leveraged OTC derivatives, such as Contracts for Difference (CFDs) and spot forex contracts, carry a high risk of loss that can potentially exceed initial deposits and may not be suitable for all investors. These instruments do not confer ownership of underlying assets. Investors must carefully evaluate their investment objectives and risk tolerance, and consult independent advisors where appropriate.


Regulated by CMA
Century Financial Consultancy LLC


.png)
.png)
.png)
.png)


Reach us:
-
Dubai
6th Floor, Emaar Square Building 4,
Downtown, Dubai, P.O. Box 65777,
Dubai, United Arab Emirates -
Abu Dhabi
27th Floor, Office 2701,
Shining Towers, Abu Dhabi, UAE -
Sharjah
29th Floor, Office 2905,
The Business Tower, Sharjah, UAE - +971 (4) 356 2800
- info@century.ae

Disclaimer: Trading in financial products carries substantial risk. Leveraged over-the-counter (OTC) derivatives, such as Contracts for Difference (CFDs) and spot forex, may result in losses exceeding initial deposits and may not be suitable for all investors. These complex instruments do not confer ownership of the underlying assets. Investors should carefully consider their investment objectives and risk appetite, and seek independent professional advice if necessary.
Century Financial Consultancy LLC (CFC) is licensed and regulated by the Capital Market Authority (CMA) of the UAE under license numbers 20200000028 and 301044 to carry out the activities of Financial Products dealer, Trading Broker in international markets, Trading Broker of OTC derivatives and currencies in the spot market, Introduction, Financial Consultations, and Promotion. CFC is incorporated under UAE law, registered with the Dubai Economic Department (No. 768189), with its office at 601, Level 6, Building No. 4, Emaar Square, Downtown Dubai, UAE, PO Box 65777.
The content on this website is provided solely for informational and educational purposes and does not constitute an offer, recommendation, or solicitation to buy or sell any securities or financial products.
Products and services offered by CFC are not intended for use in any jurisdiction where such use or distribution would breach local laws or regulatory requirements.
⚠️ Alert: Fraudulent Activity Notice
Century Financial Consultancy LLC (“Century”) has become aware of fraudulent individuals and entities impersonating our firm through unofficial websites, social media channels, and messaging applications such as Telegram, WhatsApp, and Discord.
Please be advised:
- Century does not manage investments on behalf of clients.
- Century does not solicit funds or guarantee investment returns.
- Century does not accept or make payments in cash, cryptocurrency, or digital assets.
- We do not conduct business via social media or messaging platforms.
Our only official website is www.century.ae, and all communication is conducted exclusively through verified channels.
We strongly urge the public to remain vigilant, verify the authenticity of any communication claiming to be from Century, and report any suspicious activity. Century disclaims any responsibility for losses arising from dealings with unauthorised or fraudulent parties.
