Thursday, September 11, 2025
Small Caps Catch Up? A Long RTY & Short SPX Play
By Century Financial in 'Investment Insights'

.jpg)
From the start of 2025, small caps (as represented by the RTY Index) have been a widely discussed theme among hedge funds and asset managers worldwide. However, with the onset of the Trump Tariff Threats and other macroeconomic stumbles, like high inflation and unemployment expectations, the small-cap rally did not materialize.
Looking at the YTD performance, the RTY Index is up about 7.2% as of the time of writing, while the S&P500 Index (SPX Index) is up over 10.3% even hitting all-time high levels.
This has led to the natural question of whether the small caps will at least outperform the broader market now?
For the Layman
- RTY Index trades at just over 23 times current earnings, scheduled for the coming 12 months, which is only about 6% above the SPX Index’s 22 times, representing a slim premium.
- Over the past decade, the RTY Index has consistently outperformed the SPX Index by more than 30%, presenting a value play.
- Fundamentally, given the increased expectations of a rate cut in the September 2025 meeting, policy advantage from the One Big Beautiful Bill, increased domestic manufacturing activity, and tax cut expectations, the RTY Index is expected to outperform.
- Now looking at the ratio between the RTY Index and the SPX Index, a breakout can be witnessed.
- This supports a long position on the RTY Index and a short position on the SPX Index.
Fundamentals
Interest Rate Cuts
For any company to experience a surge in its share price, it must first have strong fundamentals, which are often reflected in the company's financial performance.
According to Barclays, the total interest expense on the RTY Index represented just over half of the Index’s EBIT in the last 12 months, compared to roughly 10% for the SPX Index. From this, we can infer that interest expense is a significant line item for these firms. According to BlackRock, given that approximately 33% of RTY Index companies are financed with floating rates, compared to only 6% of companies in the SPX Index, a rate cut received in the September meeting could significantly benefit these companies.
Currently, US interest rates are in the 4.25-4.5% range, and according to the September 16-17 meeting, futures markets are pricing in an 86% probability of a 25-bps rate cut.
As of 2024, interest expense as a share of EBITDA for the RTY Index was reported to be around 36%. Given the 2024 EBITDA of $196 billion (excluding financials), the interest expense accounts for about $71 billion. Now, assuming a cost of debt of just 5% for small caps, if the Fed were to cut interest rates by 25 bps, it would reduce the interest expense to $67 billion, pulling the share down to 34%.
Policy Advantage
Furthermore, in the One Big Beautiful Bill, companies’ interest expense creates a tax deduction for interest that’s up to 30% of EBITDA. The current rule says interest is tax-deductible if it’s less than 30% of EBIT. As Industrial companies constitute a large portion of the RTY Index, the RTY Index companies generally have relatively large amounts of depreciation and amortization. That means their EBITDA is much larger than EBIT, providing a larger denominator and allowing more interest dollars to become tax-deductible.
For instance, in 2024, excluding financials, the EBITDA was $196 billion, significantly larger than the EBIT of $87 billion, as depreciation and amortization expense totalled $109 billion.
Increased Domestic Activity
The return divergence between the SPX Index and the US 2000 Index, apart from the macroeconomic factors, can also be attributed to the sectoral exposure. The SPX Index is primarily composed of the Information Technology sector, which constitutes about 35%, followed by the Financials sector with 13%, and the Consumer Discretionary sector with about 11%.
However, looking at the RTY Index, about 20% is constituted by the Industrials sector, 18% by the Financials sector, and 15% by the Healthcare sector.
Hence, looking ahead for Small Caps to outperform, the Industrials, Financials, and Healthcare sectors have to play catch-up to the leaders in software, cloud computing, and AI. But the question is, will they?
Small caps are more closely tied to the US economy, with only 20% of their revenues derived from overseas, compared to 40% for the SPX Index. Reshoring initiatives and investments in supply chain reliability could support a capital expenditure cycle favoring US-focused small caps, which have historically led to higher revenue growth. And this is exactly happening under the Trump administration.
Since Trump took office, his unwavering commitment to revitalizing American industry has spurred trillions of dollars of investments in US manufacturing, production, and innovation. For instance, Apple announced a $600 billion investment in US manufacturing and workforce training, Project Stargate, led by Japan-based Softbank and US-based OpenAI and Oracle, announced a $500 billion private investment in US-based artificial intelligence infrastructure. The list continues with NVIDIA, Micron Technology, IBM, TSMC, and so on. In total, through both domestic and foreign investments from four different countries, various US industries and manufacturers have garnered roughly $5.2 trillion in investments since 20th January 2025. This could significantly improve the top lines for small caps.
Valuations
From a valuation standpoint, even with the recent run-up, the RTY Index still remains relatively inexpensive, so any increase in expected earnings could easily boost the prices of these stocks. The RTY Index trades at just over 23 times current earnings, scheduled for the coming 12 months, which is only about 6% above the SPX Index’s 22 times, representing a slim premium. Over the past decade, the RTY Index has averaged a premium of more than 30% to the SPX Index, according to FactSet data.
Technicals
RTY Index/SPX Index Ratio Chart
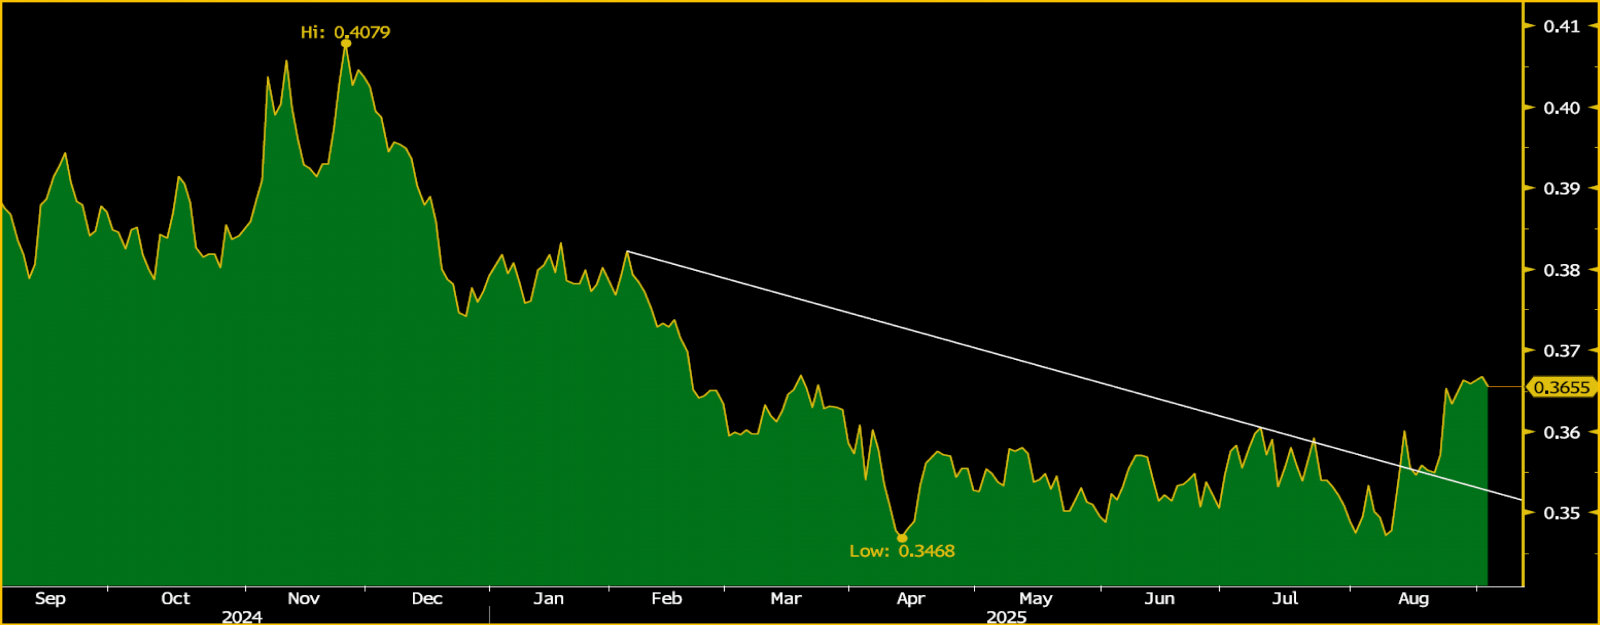
Source: Bloomberg
Date: 3rd September 2025
The chart above shows the ratio between the RTY Index and the SPX Index. It is well evident that the ratio has given a breakout. The following resistance levels are at 0.385 and 0.395. While support levels are at 0.360, followed by 0.348.
Scenario Analysis
.png)
.png)
Note:
- Costs have been ignored in the above calculations
- Prices of the SPX Index have been reverse worked using those of the RTY Index
- Base case price assumptions have been taken for the RTY Index
Risks and Assumptions related to Back-tested trading strategies
Disclaimer:Century Financial Consultancy LLC (CFC) is licensed and regulated by the Securities and Commodities Authority (SCA) of the UAE under license numbers 20200000028 and 301044 to carry out the activities of Trading Broker in international markets, Trading Broker of OTC derivatives and currencies in the spot market, Introduction, Financial Consultations, and Promotion. CFC is incorporated under UAE law, registered with the Dubai Economic Department (No. 768189), with its offce at 601, Level 6, Building No. 4, Emaar Square, Downtown Dubai, UAE, PO Box 65777.
Terms and Conditions of Access
By accessing and continuing to use the Publication (which includes this document, flyer, charts, diagrams, illustrations, images, calculations, scenario analysis, and related data or content), you confirm that you have read, understood, and agreed to the terms of this Disclaimer. CFC reserves the right to amend or update the Publication and this Disclaimer at any time without prior notice. Continued use following any such update constitutes your acceptance of the revised terms. If you do not agree with these terms, please discontinue use of the Publication.
Purpose and Intended Use
This Publication is classified as marketing material and should not be regarded as independent investment research. It is provided for informational, educational, and illustrative purposes only and does not constitute investment advice, a recommendation, an offer, or a solicitation to buy or sell any financial instruments or services. All views expressed are general market commentary and may not reflect the opinions of CFC as a whole.
Risk Disclosures and Limitations
The information presented does not cover all the risks associated with the products or scenarios discussed. Please refer to the full Risk Disclosure Statement available on our website. This Publication reflects information available at the time of preparation and does not account for subsequent developments. Any forward-looking statements involve assumptions and uncertainties; actual outcomes may differ materially. CFC does not guarantee the accuracy, completeness, or reliability of the information and disclaims liability for any action taken based on it.
No Offer or Contractual Commitment
No part of this Publication constitutes an offer, agreement, or commitment to enter into any transaction. Distribution of this Publication does not oblige CFC to engage in any trade or provide any services. Product names or terms may differ across platforms or providers. This material should not be interpreted as legal, regulatory, tax, accounting, or credit advice. Recipients should seek independent professional advice and assess their own financial situation, objectives, and risk profile before making investment decisions.
Data Sources and Interpretation
This Publication may rely on publicly available data, third-party information, or model-based assumptions. CFC makes no representation or warranty as to their accuracy or completeness. Data limitations, errors, or outdated inputs may impact the reliability of projections or scenarios. Names of financial products may differ from those used on trading platforms.
Use, Reproduction, and Analyst Disclosure
This Publication is intended solely for the recipient’s informational use. It may not be copied, transmitted, or distributed in any form, wholly or partially, without prior written permission from CFC.
Analyst Declaration: The Analyst(s) certifies that all opinions expressed in this Publication represent their own independent views and that reasonable care was taken to ensure objectivity. They do not hold securities in the companies mentioned, and their compensation is not linked to the views expressed. CFC’s research and marketing divisions operate independently.
Trading Risk Warning:
Trading in financial products involves significant risk. Leveraged OTC derivatives such as Contracts for Difference (CFDs) and spot forex contracts carry a high risk of loss, potentially exceeding initial deposits, and may not be suitable for all investors. These instruments do not confer ownership of underlying assets. Investors must carefully evaluate their investment objectives and risk tolerance, and consult independent advisors where appropriate.


Regulated by CMA
Century Financial Consultancy LLC


.png)
.png)
.png)
.png)


Reach us:
-
Dubai
6th Floor, Emaar Square Building 4,
Downtown, Dubai, P.O. Box 65777,
Dubai, United Arab Emirates -
Abu Dhabi
27th Floor, Office 2701,
Shining Towers, Abu Dhabi, UAE -
Sharjah
29th Floor, Office 2905,
The Business Tower, Sharjah, UAE - +971 (4) 356 2800
- info@century.ae

Disclaimer: Trading in financial products carries substantial risk. Leveraged over-the-counter (OTC) derivatives, such as Contracts for Difference (CFDs) and spot forex, may result in losses exceeding initial deposits and may not be suitable for all investors. These complex instruments do not confer ownership of the underlying assets. Investors should carefully consider their investment objectives and risk appetite, and seek independent professional advice if necessary.
Century Financial Consultancy LLC (CFC) is licensed and regulated by the Capital Market Authority (CMA) of the UAE under license numbers 20200000028 and 301044 to carry out the activities of Financial Products dealer, Trading Broker in international markets, Trading Broker of OTC derivatives and currencies in the spot market, Introduction, Financial Consultations, and Promotion. CFC is incorporated under UAE law, registered with the Dubai Economic Department (No. 768189), with its office at 601, Level 6, Building No. 4, Emaar Square, Downtown Dubai, UAE, PO Box 65777.
The content on this website is provided solely for informational and educational purposes and does not constitute an offer, recommendation, or solicitation to buy or sell any securities or financial products.
Products and services offered by CFC are not intended for use in any jurisdiction where such use or distribution would breach local laws or regulatory requirements.
⚠️ Alert: Fraudulent Activity Notice
Century Financial Consultancy LLC (“Century”) has become aware of fraudulent individuals and entities impersonating our firm through unofficial websites, social media channels, and messaging applications such as Telegram, WhatsApp, and Discord.
Please be advised:
- Century does not manage investments on behalf of clients.
- Century does not solicit funds or guarantee investment returns.
- Century does not accept or make payments in cash, cryptocurrency, or digital assets.
- We do not conduct business via social media or messaging platforms.
Our only official website is www.century.ae, and all communication is conducted exclusively through verified channels.
We strongly urge the public to remain vigilant, verify the authenticity of any communication claiming to be from Century, and report any suspicious activity. Century disclaims any responsibility for losses arising from dealings with unauthorised or fraudulent parties.
