Recognizing trading patterns is one of the most versatile skills you can learn in trading. This is the branch of technical analysis focused on finding price (and often volume) patterns.
The trading price pattern helps spot changes between uptrends and downtrends. Traders look for price patterns that indicate changes in market trends and execute trades based on those signals. Trading patterns can also be used to predict market reversals and trend continuations.
The key is to spend time learning the basic rules. This will allow you to use these methods effectively in your trading strategy.
The idea of pattern recognition may seem strange, but it is based on carefully tested methods highlighting its usefulness for traders. Importantly, patterns are factors to consider when calculating where to enter, setting stop-loss orders, and setting profit targets. Of course, these factors are some of the most important things every trader should consider when managing their overall portfolio.
- Recognize how price movements evolve into price patterns
- Separate meaningful entry points
- Manage risk with stop loss and set profit targets
Types of trading patterns
Pattern recognition is based on looking for patterns that appear in the prices of traded commodities. You should look for shapes such as triangles, rectangles, and rhombuses. These may not inspire confidence at first but are formations that emerge as they track changes in support and resistance.
Once you've mastered these skills, you can apply them to any financial market of your choice, from stocks to indices to foreign exchange. Pattern recognition can form the basis of trading strategies for day traders, swing traders, and long-term position traders and can be applied to anything from 5-minute charts to weekly charts.
Rectangles, especially triangles, have many variations available. Essentially, all price patterns look at the interaction of supply and demand over time to determine wise ways to react when these patterns form. This will help you know how to respond from risk management and close-out perspective.
Triangle Trading Patterns
There are different triangles, all of which are very effective for trading. The advantage is that it is neither long-side nor short-side biased, which is very useful from a CFD trader's point of view. Keep in mind that if you always focus on the long side of the market, you may miss some of the most attractive features of this pattern. The triangle is a pattern in which the prices are consolidated. However, it has no long or short sides, so you must be careful with the triangles when the eventual breakout occurs. There are two main categories of triangles that are formed:
- The ascending and descending triangles (the opposite of one another), and
- The symmetrical triangle
Ascending triangle
The Ascending Triangle is probably the best-known pattern in this category, as it involves resistance lines (which traders often look for) and rising support lines.
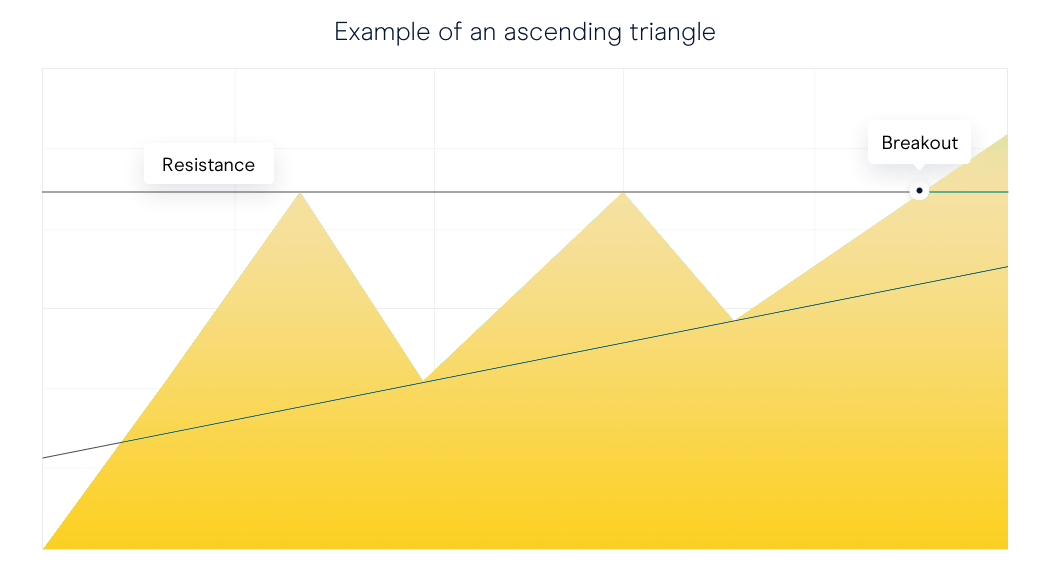
The important part of this formation is the two lines marked in red: the resistance line and the uptrend line. You should keep an eye on trading volumes during pattern formation and see how volumes are affected when breakouts occur.
You will usually notice the volume decreasing over time as the pattern forms. One way he thinks about this drop is that buyers and sellers are gradually forced into an ever-tighter balance between support and resistance until prices break out and start rising again. It means that you are keeping your interest away. If the volume doesn't go down, it doesn't necessarily mean that the pattern is the problem. However, when breakouts occur, you should watch out for spikes in volume. This tends to positively affect the overall strength of the pattern from then on. This indicates an increase in demand (or supply in case of short trades) of the commodity, adding an excellent price confirmation to the trader. Traders can be put off by this feeling that they have missed a trade, but in reality, this is probably confirmation that they have correctly recognized that a breakout is occurring.
What traders fear when it comes to breakout pattern trades is what is known as a false breakout or whipsaw. This happens when the price breaks a pattern, and aggressive traders can jump right into the trade. Unfortunately, what happens in the case of a false breakout is what happens when you get what looks like an actual signal, but later the price pulls back within the bounds of the pattern, and you are left holding a trade that is not doing what you hoped it would.
The only way to combat this is to apply some filters. The most obvious way is to wait for X to close outside the pattern. Looking at the daily chart, we can wait two days for the price to close outside the pattern. There are other ways to avoid this type of false breakout. Some traders wait for the price to move outside the pattern by twice the average true range (2ATR). None of these methods guarantees that you won't suffer from false breakouts. The preceding graph illustrates an ascending triangle with a breakout to the upside. As there is no directional bias on which patterns will break out, we must also examine an example of a downward break on an ascending triangle.
.png)
You can see that the basic setup is exactly the same, except the breakout is in the opposite direction. This requires a short trade. Both of these examples show retracements to the line they exited. This can happen even if the signal is not considered an error, but don't assume it will always be the case. In fact, you would think that the instances where this does not occur are when you are receiving the strongest signals.
Descending triangle
The descending triangle is the opposite of the previously described ascending triangle, which has similar properties but is built in the opposite direction. Like its ascending counterpart, breakouts can go in either direction, so you should be aware of the direction in which breakouts occur.

As with all patterns, these examples are rarely exactly the same. These figures show the best-case scenario, but in most cases, you want the price action to follow the chart as closely as possible.
Some traders suggest that the price should move away from the support and resistance points and not spend too much time drifting sideways. For a triangle pattern, we want the price to break out of the pattern before reaching the 75% peak. Because if the pattern continues sideways, it may start to lose momentum and continue to drift sideways. This is far from what the breakout his traders want.
.png)
Symmetrical triangle
The symmetrical triangle shares some characteristics with the ascending/descending triangle as the price is forced into a narrower range of price movement, and traders are looking for price breakouts. Additionally, we can see that the volume traded for this instrument decreases as it moves through the formation and then becomes significantly above average when breakouts occur.
As with any triangle, there is the possibility of false breakouts, so it's worth applying a filter to breakouts to reduce your exposure to whipsaw entries into trades. Again, this could be the number of closing prices above the breakout level, or alternatively, a filter such as the Average True Range could be used.
In these trades, as in all triangles, there are two main places where stop loss orders are placed. A more aggressive trader may place a stop on the opposite side of the breakout line. This is almost the same as being able to set a stop loss realistically. Otherwise, the transaction has no chance of success. Another more conservative method is to place the stop completely on the opposite side of the pattern. This indicates a complete failure of the setup if that level is reached.
Rectangle trading patterns
After looking at setups where the support and resistance levels are close together, the rectangular setup shows where the two levels are parallel. Although the patterns look quite different for each triangle family, their behaviour regarding breakout and risk management settings is very similar.
.png)
This chart again illustrates the breakout having a subsequent throwback to what was the resistance line, but this will not always be the case. Like the triangle, the best outcome is a strong continuation from this level on high volume from the point of the breakout.
Flag trading patterns
Like the pennant, the flag is a short-term version of a similar pattern (channel in this case). It takes many of the same qualities as a pennant to ensure the flag is authentic.
This pattern is only accurate if the breakout occurs in the same direction that the price entered. It also tends to show the direction of the flag in the opposite direction of general price action.
.png)
Both flags and pennants appear after strong price movements. This near-vertical price movement forms the "flagpole" on which the pennant or flag occurs. It's important to check this beforehand because the pattern is not genuine without it. Finally, both breakouts are likely to be accompanied by a spike in volume, which will further confirm the pattern.
Stop placement follows the same basic rules as above. A more aggressive trader will close the trade at the first sign of failure, while a more conservative trader may look for a price above the pattern before deeming it a failure.
Price targets
It is possible to use all the described patterns to target an eventual take profit point. For triangles and rectangles, this can be done by simply measuring the pattern's height and extrapolating the target from the breakout points.
.png)
The same basic assumptions apply to rectangles. For flags and pennants, targets are determined by measuring the height of the flagpole leading into the formation and adding it to the middle. These patterns are sometimes called gauge patterns because they often occur in the middle of a price movement.
.png)
Summary
- You should recognize the basic price conditions required for a pattern to be genuine
- You should know how to tell when a pattern has failed
- You should be able to generate a sensible risk-management plan in line with your pattern-recognition skill
Source: CMC Markets UK
Disclaimer: Century Financial Consultancy LLC (“CFC”) is Limited Liability Company incorporated under the Laws of UAE and is duly licensed and regulated by the Emirates Securities and Commodities Authority of UAE (SCA). This document is a marketing material and is for informational purposes only and must not be construed to be an advice to invest or otherwise in any investment or financial product. CFC does not guarantee as to adequacy, accuracy, completeness or reliability of any information or data contained herein and under no circumstances whatsoever none of such information or data be construed as an advice or trading strategy or recommendation to deal (Buy/Sell) in any investment or financial product. CFC is not responsible or liable for any result, gain or loss, based on this information, in whole or in part.
PLEASE READ THE FOLLOWING TERMS AND CONDITIONS OF ACCESS FOR THE PUBLICATION BEFORE THE USE THEREOF.
By use of the publication and continuing to access the publication, you accept these terms and conditions and undertake to be bound by the acceptance. CFC reserves the right to amend, remove, or add to the publication and Disclaimer at any time without any prior notice to you. Such modifications shall be effective immediately. Accordingly, please continue to review this Disclaimer whenever accessing, or using the publication. Your access of, and use of the publication, after modifications to the Disclaimer will constitute your acceptance of the terms and conditions of use of the publication, as modified. If, at any time, you do not wish to accept the content of this Disclaimer, you may not access, or use the publication. Any terms and conditions proposed by you which are in addition to or which conflict with this Disclaimer are expressly rejected by CFC and shall be of no force or effect.
No information as given herein by CFC in this publication should be construed as an offer, recommendation or solicitation to purchase or dispose of any securities/financial instruments/products or to enter in any transaction or adopt any hedging, trading or investment strategy. Neither this publication nor anything contained herein shall form the basis of any contract or commitment whatsoever. Distribution of this publication does not oblige CFC to enter into any transaction.
The content of this publication should not be considered legal, regulatory, credit, tax or accounting advice. Anyone proposing to rely on or use the information contained in the publication should independently verify and check the accuracy, completeness, reliability and suitability of the information and should obtain independent and specific advice from appropriate professionals or experts regarding information contained in this publication. CFC cannot be held responsible for the impact of any transactional costs or any taxes as may be applicable on transactions.
Information contained herein is based on various sources, including but not limited to public information, annual reports and statistical data that CFC considers reliable. However, CFC makes no representation or warranty as to the accuracy or completeness of any report or statistical data made in or in connection with this publication and accepts no responsibility whatsoever for any loss or damage caused by any act or omission taken as a result of the information contained in this publication. The articles does not take into account the investment objectives, financial situations and specific needs of recipients. The recipient of this publication must make its own independent decisions regarding whether this communication and any securities or financial instruments mentioned herein, is appropriate in the light of its existing portfolio holdings and/or investment needs.
This document is a marketing material and has been prepared by individual(s), marketing and/or research personnel of CFC. It has not been prepared in accordance with legal requirements designed to promote the independence of investment research and as such is purely a marketing communication. In this publication, any opinions, news, research, analysis, prices, or other information constitute is a general market commentary, and do not constitute the opinion or advice of CFC or any form of personal or investment advice. CFC neither endorses nor guarantees offerings of third party, nor is CFC responsible for the content, veracity or opinions of third-party speakers, presenters, participants or providers. CFC will not accept liability for any loss or damage, including without limitation to, any loss of profit, which may arise directly or indirectly from use of or reliance on such information.
Charts, graphs and related data or information provided in this publication are intended to serve for illustrative purposes only. The information contained in this publication is prepared as of a particular date and time and will not reflect subsequent changes in the market or changes in any other factors relevant to their determination. All statements as to future matters are not guaranteed to be accurate. CFC expressly disclaims any obligation to update or revise any forward-looking statements to reflect new information, events or circumstances after the date of this publication or to reflect the occurrence of unanticipated events.
Staff members/employees of CFC may provide/present oral or written market commentary or analysis to you that reflect opinions that are contrary to the opinions expressed in this research and may contain insights and reports that are inconsistent with the views expressed in this publication. Neither CFC nor any of its affiliates, group companies, directors, employees, agents or representatives assume any liability nor shall they be made liable for any damages whether direct, indirect, special or consequential including loss of revenue or profits that may arise from or in connection with the use of the information provided in this publication.
Information or data provided by means in this publication may have many inherent limitations, like module errors or lack accuracy in its historical data. Data included in the publication may rely on models that do not reflect or take into account all potentially significant factors such as market risk, liquidity risk, credit risk etc.
The use of our information, products and services should be on your own due diligence and you agree that CFC is not liable for any failure to achieve desired return on investment that is in any manner related to availing of services or products of CFC and use of our information, products and services. You acknowledge and agree that past investment performance is not indicative of the future performance results of any investment and that the information contained herein is not to be used as an indication for the future performance of any investment activity.
This publication is being furnished to you solely for your information and neither it nor any part of it may be used, forwarded, disclosed, distributed or delivered to anyone else. You may not copy, reproduce, display, modify or create derivative works from any data or information contained in this publication.
Services offered by CFC include products that are traded on margin and can result in losses that exceed deposits. Before deciding to trade on margin products, you should consider your investment objectives, risk tolerance and your level of experience on these products. Trading with leverage carries significant risk of losses and as such margin products are not suitable for every investor and you should ensure that you understand the risks involved and should seek independent advice from professionals or experts if necessary.
Ready to Invest?
Explore a new trading experience with
Century Trader App
Losses can exceed your deposits
Ready to Invest?
Explore a new trading experience with
Century Trader App
Losses can exceed your deposits

Regulated by CMA
Century Financial Consultancy LLC


.png)
.png)
.png)
.png)
.png)

Reach us:
-
Dubai
6th Floor, Emaar Square Building 4,
Downtown, Dubai, P.O. Box 65777,
Dubai, United Arab Emirates -
Abu Dhabi
27th Floor, Office 2701,
Shining Towers, Abu Dhabi, UAE -
Sharjah
29th Floor, Office 2905,
The Business Tower, Sharjah, UAE - +971 (4) 356 2800
- info@century.ae

Disclaimer: Trading in financial products carries substantial risk. Leveraged over-the-counter (OTC) derivatives, such as Contracts for Difference (CFDs) and spot forex, may result in losses exceeding initial deposits and may not be suitable for all investors. These complex instruments do not confer ownership of the underlying assets. Investors should carefully consider their investment objectives and risk appetite, and seek independent professional advice if necessary.
Century Financial Consultancy LLC (CFC) is licensed and regulated by the Capital Market Authority (CMA) of the UAE under license numbers 20200000028 and 301044 to carry out the activities of Financial Products dealer, Trading Broker in international markets, Trading Broker of OTC derivatives and currencies in the spot market, Introduction, Financial Consultations, and Promotion. CFC is incorporated under UAE law, registered with the Dubai Economic Department (No. 768189), with its office at 601, Level 6, Building No. 4, Emaar Square, Downtown Dubai, UAE, PO Box 65777.
The content on this website is provided solely for informational and educational purposes and does not constitute an offer, recommendation, or solicitation to buy or sell any securities or financial products.
Products and services offered by CFC are not intended for use in any jurisdiction where such use or distribution would breach local laws or regulatory requirements.
⚠️ Alert: Fraudulent Activity Notice
Century Financial Consultancy LLC (“Century”) has become aware of fraudulent individuals and entities impersonating our firm through unofficial websites, social media channels, and messaging applications such as Telegram, WhatsApp, and Discord.
Please be advised:
- Century does not manage investments on behalf of clients.
- Century does not solicit funds or guarantee investment returns.
- Century does not accept or make payments in cash, cryptocurrency, or digital assets.
- We do not conduct business via social media or messaging platforms.
Our only official website is www.century.ae, and all communication is conducted exclusively through verified channels.
We strongly urge the public to remain vigilant, verify the authenticity of any communication claiming to be from Century, and report any suspicious activity. Century disclaims any responsibility for losses arising from dealings with unauthorised or fraudulent parties.
