What Is the VIX Index?
The VIX, short for VIX Index or Volatility Index, is widely known as the market fear gauge. It does not tell you whether prices will move up or down. Instead, it tells you how turbulent that journey might be over the next month. Think of it like a weather report for the stock market. Sunny and calm? The VIX is usually low. Storm clouds gathering? The VIX starts to climb.
Here, you will learn more about VIX and understand VIX, and terms like VIX stock or VIX share price will feel less confusing, and you will see where the VIX fits inside a practical trading toolkit.
Why Is Understanding the VIX Important?
The VIX index gives a real-time picture of the expected volatility in the S&P 500 over the next 30 days. In the sea of indicators and measures that show you what might happen in the future based purely on historical data, VIX is calculated from options prices on the S&P 500, which makes it a forward-looking volatility index, not a backward-looking measure of what already happened.
As one of the most popular tools of its kind, VIX not only indicates market sentiment but also serves as a litmus test of market sentiment. Volatility arises when certain market factors are triggered, and the VIX makes this easier to read.
VIX As a Predictor
The VIX helps gauge how shaky the markets are going to be, but it won't give you indications on where the market is headed. When you trade, whether it's CFDs, futures, or indices, you can use VIX in conjunction with other tools as an additional confirmation layer. For example, with a rising VIX, you can expect the swings to be sharper and place your entry and exits accordingly, thereby harnessing volatility to work in your favor. While analyzing VIX for your trade, remember that it is:
- Implied, and realized
- A forward-looking window
- Signals risk levels and not directions
Correlation with Market Sentiments
The VIX often moves opposite stock markets because it reflects how uncertain traders feel. When confidence is high, investors are more willing to hold positions without much protection. Option prices stay relatively low during such periods, and the VIX index drifts downward. It is a sign that traders expect the market to behave in a calm, predictable manner.
Retail and Institutional Uses
Retail and institutional traders both follow the VIX, but they use it with different objectives. Retail traders typically treat it as a context tool, checking whether volatility is high or low before adjusting position size or combining it with technical indicators. Institutions take a broader approach, utilizing the Volatility Index in risk models, hedging programs, and the construction of volatility-linked products based on VIX futures.
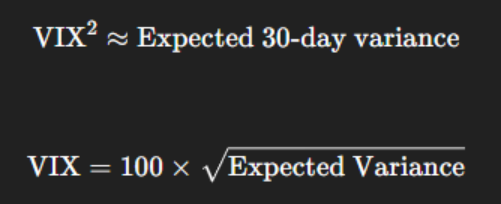
How the VIX Index Is Calculated
Formula and Process
The calculation uses out-of-the-money call and put options to estimate the expected magnitude of price swings for the next 30 days. The model converts option premiums into implied volatility values, then blends them into a single number that represents the market’s view of upcoming volatility. When option prices rise because traders expect sharper moves, the VIX rises as well. The formula looks something like this:
Types of Calculations
The standard VIX index measures 30-day expected volatility, but variations exist. Short-term versions track nine-day volatility expectations. It focuses on near-immediate volatility expectations. It reacts quickly to news, policy announcements, or sudden shifts in sentiment because its calculation window is very narrow.
The long-term version, commonly known as the 3-month VIX, smooths out short-lived spikes and captures broader expectations. It is less sensitive to intraday events and more reflective of medium-term uncertainty.
Key Variables and Their Influence
A few key aspects comprise the Volatility Index formula, and traders who understand these factors and their impact can interpret not only the VIX index but also the broader market with greater efficiency.
- Option Premiums are a key element and are the market prices of options. Higher premiums usually indicate that traders expect larger market swings.
- Options with different time to expiry contribute differently to the VIX. The model standardizes this time to create a consistent 30-day volatility estimate.
- Strike prices of various levels are used to capture the complete picture of expected volatility. Wider strike ranges help the index more accurately reflect market sentiment.
- Forward Index Level estimates where the S&P 500 is expected to be in the near term. It helps balance call and put options within the calculation.
- The nearest strike below the forward level, or K₀, acts as an anchor point in the formula. It determines how option prices are weighted when building the final variance measure.
- The risk-free rate adjusts option prices for time. It ensures the VIX index reflects present-value expectations rather than inflated future values.
How Traders Use the VIX in Currency and Stock Markets
The Volatility Index is a trusted indicator of market sentiment, but when used correctly, it can become an asset that generates significant returns. Throughout the financial market, traders used it as a quick reference point before making decisions. Here are some of the significant uses of the VIX index:
- As a fast read on overall fear or confidence
- Estimate potential swings in major equity indices
- As a guide for position sizing during calm or volatile markets
- Recognize shifts between risk-seeking and haven currencies
- Timing decisions for stock, index, and currency CFD trades
- Integrate with other indicators like Bollinger Bands and Donchian Channels
- Anticipate changes in spreads, liquidity, or market depth
Pros and Cons of Trading the VIX
Trading instruments linked to the VIX can offer unique opportunities, but they also require a clear understanding of how volatility behaves. Here is a simple comparison.
| Pros | Cons |
|---|---|
| Offers exposure to market volatility | Can move sharply and unexpectedly |
| Useful for diversification during uncertain periods | Products may not match VIX movements perfectly |
| Helps traders hedge broader market positions | Requires understanding of volatility dynamics |
| Reacts quickly to major news and sentiment shifts | Not suitable for every trading style or time horizon |
Real-World Examples of VIX Impact
Major global events often show how quickly volatility can rise and how strongly the VIX can react. These moments help traders understand why monitoring the VIX is crucial when navigating rapidly changing markets.
2008 Global Financial Crisis
Before the financial crisis began, the VIX remained within its normal range, indicating a relatively calm market. However, as problems within the economic system started to emerge, more people began buying options, which caused the VIX to rise into the mid-20s. When Lehman Brothers went bankrupt and global credit markets came to a standstill, market volatility skyrocketed at an unprecedented rate. The VIX spiked above 80, its highest level at the time, signaling intense fear and severe disruption across global markets. This shift illustrated how quickly uncertainty can escalate and how the VIX responds long before price charts show the full impact.
2020 Pandemic volatility
Leading into early 2020, the VIX was trading at calm levels near 12–15, consistent with a long period of steady equity market gains. As news of the virus spread and policy responses remained unclear, volatility began rising steadily, taking the VIX into the mid-20s. Once global lockdowns and rapid market sell-off began, the VIX surged past 80, matching and briefly exceeding the levels seen in 2008. The speed of this spike demonstrated how sensitive the VIX is to sudden shocks and how dramatically option prices rise when markets struggle to understand new risks.
Takeaways for Modern Traders
Both periods show that the VIX often reacts earlier and more sharply than price charts alone. Monitoring it can help traders prepare for sudden swings, manage risk, and navigate index trading with better awareness during uncertain conditions.
How to Trade the VIX with Century Platforms
Traders can follow and trade volatility-linked instruments through Century’s ecosystem of platforms, each designed for different styles of market analysis.
The Century Trader App offers quick, mobile execution, while MT5, CQG, and TWS provide advanced charting, market depth, and multi-asset access for those who want to integrate VIX signals into broader indices trading strategies. Together, these platforms give traders flexible ways to monitor volatility and respond to changing market conditions.
FAQs
Q1. What does the VIX Index measure?
A: The VIX measures the market’s expectation of volatility in the S&P 500 over the next 30 days. It reflects how large future price swings may be based on real-time option prices rather than past movements.
Q2: Is VIX stock? What is the VIX share price?
A: The VIX is not a stock, so it does not have a share price. It is an index built from option premiums, and products labelled as “VIX shares” or “VIX stock” usually refer to instruments that track VIX futures rather than the VIX itself.
Q3: What do very high and very low VIX indicate?
A: A very high VIX signals that traders expect sharp market swings and greater uncertainty. A very low VIX suggests calmer conditions where markets are expected to move more steadily with fewer surprises.
Q4. Can retail traders directly invest in the VIX?
A: Retail traders cannot buy the VIX directly because it is an index, not a tradable asset. They can access volatility through instruments that track VIX futures on supported trading platforms, depending on availability.
Q5. What are the best strategies for trading VIX volatility?
A: The best approach depends on experience and risk appetite, but traders often combine volatility indicators, watch changes in sentiment, and use the VIX alongside broader market signals.
Century Financial Consultancy LLC (CFC) is duly licensed and regulated by the Securities and Commodities Authority of UAE (SCA) under license numbers 2020000028 and 2020000081, to practice the activities of Trading broker in the international markets, Trading broker of the Over-The-Counter (OTC) derivatives and currencies in the spot market, Introduction, Financial Consultation and Financial Analysis, and Promotion. CFC is a Limited Liability Company incorporated under the laws of the UAE and registered with the Department of Economic Development of Dubai (registration number 768189).
CFC may provide research reports, analysis, opinions, forecasts, or information (collectively referred to as Information) through CFC’s Websites, or third-party websites, or in any of its newsletters, marketing materials, social media, individual and company e-mails, print and digital media, WhatsApp, SMS or other messaging services, letters, and presentations, individual conversations, lectures (including seminars/webinars) or in any other form of verbal or written communication (collectively referred to as Publications).
Any Information provided in this publication is provided only for marketing, educational and/or informational purposes. Under no circumstances is any Information meant to be construed as an offer, recommendation, advice, or solicitation to buy or sell trading positions, securities, or other financial products. CFC makes no representation or warranty as to the accuracy or completeness of any report or statistical data made in or in connection with this Publication and accepts no responsibility whatsoever for any loss or damage caused by any act or omission taken as a result of the use of the Information.
Please refer to the full risk disclosure mentioned on our website.
Ready to Invest?
Explore a new trading experience with
Century Trader App
Losses can exceed your deposits
Ready to Invest?
Explore a new trading experience with
Century Trader App
Losses can exceed your deposits

Regulated by CMA
Century Financial Consultancy LLC


.png)
.png)
.png)
.png)
.png)

Reach us:
-
Dubai
6th Floor, Emaar Square Building 4,
Downtown, Dubai, P.O. Box 65777,
Dubai, United Arab Emirates -
Abu Dhabi
27th Floor, Office 2701,
Shining Towers, Abu Dhabi, UAE -
Sharjah
29th Floor, Office 2905,
The Business Tower, Sharjah, UAE - +971 (4) 356 2800
- info@century.ae

Disclaimer: Trading in financial products carries substantial risk. Leveraged over-the-counter (OTC) derivatives, such as Contracts for Difference (CFDs) and spot forex, may result in losses exceeding initial deposits and may not be suitable for all investors. These complex instruments do not confer ownership of the underlying assets. Investors should carefully consider their investment objectives and risk appetite, and seek independent professional advice if necessary.
Century Financial Consultancy LLC (CFC) is licensed and regulated by the Capital Market Authority (CMA) of the UAE under license numbers 20200000028 and 301044 to carry out the activities of Financial Products dealer, Trading Broker in international markets, Trading Broker of OTC derivatives and currencies in the spot market, Introduction, Financial Consultations, and Promotion. CFC is incorporated under UAE law, registered with the Dubai Economic Department (No. 768189), with its office at 601, Level 6, Building No. 4, Emaar Square, Downtown Dubai, UAE, PO Box 65777.
The content on this website is provided solely for informational and educational purposes and does not constitute an offer, recommendation, or solicitation to buy or sell any securities or financial products.
Products and services offered by CFC are not intended for use in any jurisdiction where such use or distribution would breach local laws or regulatory requirements.
⚠️ Alert: Fraudulent Activity Notice
Century Financial Consultancy LLC (“Century”) has become aware of fraudulent individuals and entities impersonating our firm through unofficial websites, social media channels, and messaging applications such as Telegram, WhatsApp, and Discord.
Please be advised:
- Century does not manage investments on behalf of clients.
- Century does not solicit funds or guarantee investment returns.
- Century does not accept or make payments in cash, cryptocurrency, or digital assets.
- We do not conduct business via social media or messaging platforms.
Our only official website is www.century.ae, and all communication is conducted exclusively through verified channels.
We strongly urge the public to remain vigilant, verify the authenticity of any communication claiming to be from Century, and report any suspicious activity. Century disclaims any responsibility for losses arising from dealings with unauthorised or fraudulent parties.
