
Tuesday, June 02, 2020
The technical signals Chris Kimble spotted ahead of the market crash
By Century Financial in 'Brainy Bull'

.png)
Traders and investors who describe COVID-19 as a black swan event should have looked to the technical indicators in their charts, according to veteran technical analyst Chris Kimble, who believes that the virus was foreseeable. He noticed early on that stock markets were on the road to a major downturn, as signals from the deteriorating performance of the banking sector made it evident.
“A lot of people talked about the decline as a black swan and I beg to differ. Hollywood made three large budget movies about a virus or pandemic … so that shouldn’t have been a surprise,” he told Opto Sessions.
In addition, the banking sector had started suggesting a cautionary message of negative divergence in January 2018.
“When you divide the banking index in the States, which is BKX [KBW Nasdaq Bank Index] divided by SPX [S&P Banks Select Industry Index], it is hard to believe that the ratio is now below the Financial Crisis 2009 lows. Ever since the banks started showing relative weakness, the S&P has made a whopping 3% in 28 months,” Kimble said.

“But when you start looking at broader indices, the New York Stock Exchange is down 10%, small-caps and mid-caps are down 15% and banks are down 40%. It’s been almost a bipolar market. I love the adage that I heard years ago — so goes banks, so goes the broader markets.”
Kimble said he started sharing the banking negative divergence with his clients more than two years ago.
Listen to the full podcast episode here:
Looking to history for clues of a rebound
Following the market plunge, Kimble also used his skills in studying historical technical analysis to predict when a rally would take hold.
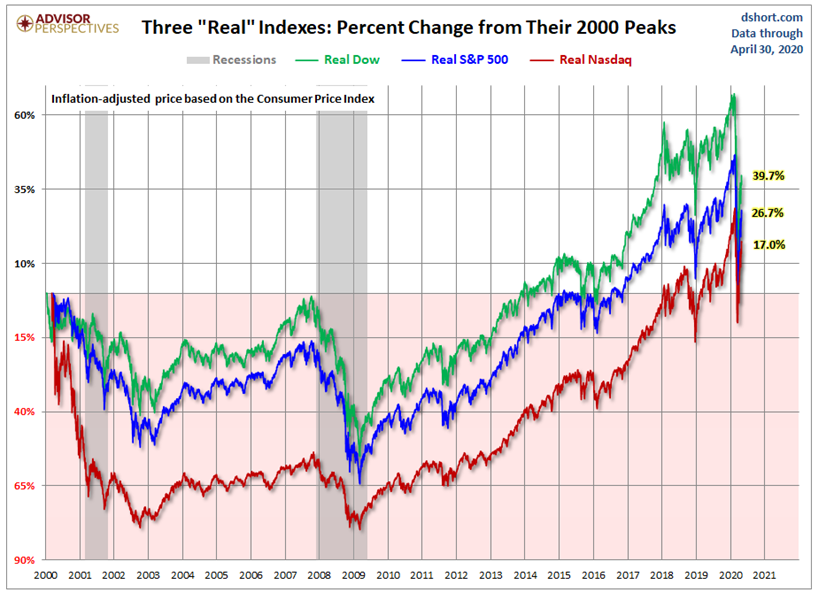
“There have been four 50% declines or greater in the US stock market over the last 100 years. In the last three — 1973 to 1974, 2000 to 2003 and 2007 to 2009 — counter-trend rallies all started in the first week of spring. They lasted eight weeks from the low,” he explained.
“We went to our customers in the first week of spring and said we believe that if history is to repeat that we should see a strong rally going forward, it should last eight weeks. The thing I find fascinating is that the rally started on 23 March, eight weeks later is this week [commencing 18 May].”
Kimble said that from looking at repeats in historical patterns, the rally was expected. As to what happens next, he pointed to the last three times that the first major counter-trend rallies were at eight weeks.
“That’s when the largest portions of the bear markets followed over the next couple of years. We’re essentially there right now. When you look at the chart of the Nasdaq 100 and divide that by the Nasdaq Composite Index, the ratio has been heading higher for 18 years,” he stated.

“It’s moved up since the 2002 low, which essentially reflects that a few stocks are powering the tech rally. The generals are moving forward but the troops aren’t participating to the same degree. We have to sit back and remain open-minded that there is a possibility that the Nasdaq could be double-topping 20 years later. In March and April, the ratio of index divided by the Nasdaq Composite Index created back-to-back large bearish reversal patterns exactly at the 2000 highs.”
But the charts can also raise hopes. As of April, the Thomson Reuters Equal Weighted Commodity Index is trading at the exact same levels as its 2009 lows. Kimble has noticed that this is creating a bullish reversal pattern for the index, as it nears its 1980 high. However, if commodities collapse and the index were to take out the 2009 low, there could be further trouble.

“Being an optimist, I hope this pattern is suggesting that the darkest of times for commodities [is over],” Kimble considered. “I would love for the world to start witnessing some higher commodity prices because maybe it means that the worst is behind us.”
Source: This content has been produced by Opto trading intelligence for Century Financial and was originally published on cmcmarkets.com/en-gb/opto
Disclaimer: Past performance is not a reliable indicator of future results.
The material (whether or not it states any opinions) is for general information purposes only and does not take into account your personal circumstances or objectives. Nothing in this material is (or should be considered to be) financial, investment or other advice on which reliance should be placed. No opinion given in the material constitutes a recommendation by Century Financial or the author that any particular investment, security, transaction or investment strategy is suitable for any specific person.
Century Financial does not endorse or offer opinion on the trading strategies used by the author. Their trading strategies do not guarantee any return and Century Financial shall not be held responsible for any loss that you may incur, either directly or indirectly, arising from any investment based on any information contained herein.


Regulated by CMA
Century Financial Consultancy LLC


.png)
.png)
.png)
.png)

Reach us:
-
Dubai
6th Floor, Emaar Square Building 4,
Downtown, Dubai, P.O. Box 65777,
Dubai, United Arab Emirates -
Abu Dhabi
27th Floor, Office 2701,
Shining Towers, Abu Dhabi, UAE -
Sharjah
29th Floor, Office 2905,
The Business Tower, Sharjah, UAE - +971 (4) 356 2800
- info@century.ae

Disclaimer: Trading in financial products carries substantial risk. Leveraged over-the-counter (OTC) derivatives, such as Contracts for Difference (CFDs) and spot forex, may result in losses exceeding initial deposits and may not be suitable for all investors. These complex instruments do not confer ownership of the underlying assets. Investors should carefully consider their investment objectives and risk appetite, and seek independent professional advice if necessary.
Century Financial Consultancy LLC (CFC) is licensed and regulated by the Capital Market Authority (CMA) of the UAE under license numbers 20200000028 and 301044 to carry out the activities of Financial Products dealer, Trading Broker in international markets, Trading Broker of OTC derivatives and currencies in the spot market, Introduction, Financial Consultations, and Promotion. CFC is incorporated under UAE law, registered with the Dubai Economic Department (No. 768189), with its office at 601, Level 6, Building No. 4, Emaar Square, Downtown Dubai, UAE, PO Box 65777.
The content on this website is provided solely for informational and educational purposes and does not constitute an offer, recommendation, or solicitation to buy or sell any securities or financial products.
Products and services offered by CFC are not intended for use in any jurisdiction where such use or distribution would breach local laws or regulatory requirements.
⚠️ Alert: Fraudulent Activity Notice
Century Financial Consultancy LLC (“Century”) has become aware of fraudulent individuals and entities impersonating our firm through unofficial websites, social media channels, and messaging applications such as Telegram, WhatsApp, and Discord.
Please be advised:
- Century does not manage investments on behalf of clients.
- Century does not solicit funds or guarantee investment returns.
- Century does not accept or make payments in cash, cryptocurrency, or digital assets.
- We do not conduct business via social media or messaging platforms.
Our only official website is www.century.ae, and all communication is conducted exclusively through verified channels.
We strongly urge the public to remain vigilant, verify the authenticity of any communication claiming to be from Century, and report any suspicious activity. Century disclaims any responsibility for losses arising from dealings with unauthorised or fraudulent parties.
