A trendline could also be called a ‘trend support line’ because it shows the direction of a trend, and it acts as a support line.
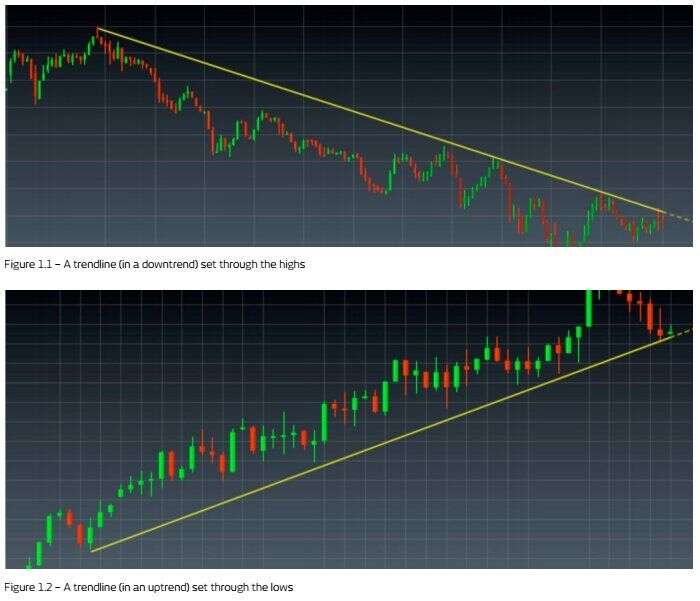
With downtrends, trendlines are formed by drawing a straight line through a series of descending lower highs. The charts below are examples of down and up trendlines. It's usual practice to join the highs or lows (wicks) of the candlesticks and not the closing prices.
Uptrend and downtrend examples
Common trendline and channel rules
These two rules are usually applied to trendlines and channels:
- Declines in price that approach an uptrend line, or price rises that approach a downtrend line, can be good opportunities to initiate positions in the same direction as the trendline.
- The penetration of an uptrend line, particularly on a closing basis, is a sell signal, and the penetration of a downtrend line is a buy signal. Normally, analysts apply a minimum percentage price move (1% breach on a stock for example) through the line or a minimum price move.
According to the first rule, as price approaches an uptrend line, the trendline (if it's a valid one) tends to act as a support, so one could buy as price approaches the line. The line must not be breached. If a trendline is cut through, then we can say in effect that a support has been breached and we could act as we would if it were a normal support break.
Conversely, downtrend lines tend to act as resistances. One could sell as the price approaches the line — again it must not be breached. In the chart immediately below, you will notice our entry points would be chosen with this in mind, providing 'cheaper' buy-in levels in an uptrend, nearer the trendline; and in a downtrend, providing higher levels to sell into a downtrend.

The 'sell' points in the above chart represent the ideal 'sell' orders, which would tend to cluster near and underneath a downtrend line. The reason they have to be underneath and not above, is that a downtrend line acts like a resistance line. Price action above the line would, by definition, be a 'technical break' over the line, which would mean a trader could expect a short-term spike, so could be looking to exit short trades rather than enter them.
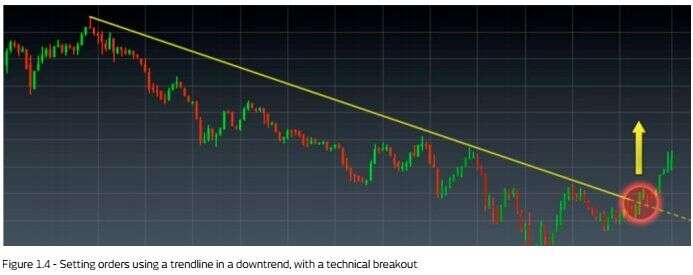
In this chart, you can see an example of a downtrend and trendline for most of the chart, with the ideal selling points (shown by the trendline) throughout the course of the downtrend. Then, as all good trends do, the trend comes to an end with the break of the downtrend line and resultant short-term spike that follows.
Redrawing trendlines
Changes in trend speed may necessitate the redrawing of lines. This is particularly important if they are breached temporarily, only to resume the trend, as this could make the lines themselves unreliable.

While penetrations of trendlines often warn of a trend reversal, a breach usually also means you will need to redraw a trendline, as shown by the chart above. It's not enough to show a trendline that works — it's important that the trend method also works.
Disclaimer: To read more about the disclaimer Click here
هل أنت مستعد للاستثمار؟
استكشف تجربة تداول جديدة مع
تطبيق سنشري تريدر
يمكن أن تتجاوز الخسائر قيمة إيداعاتك
هل أنت مستعد للاستثمار؟
استكشف تجربة تداول جديدة مع
تطبيق سنشري تريدر
يمكن أن تتجاوز الخسائر قيمة ودائعك

تنظمها هيئة الأوراق المالية والسلع
سنشري للاستشارات المالي ش.ذ.م.م


تصل إلينا:
-
دبي
الطابق رقم 6, مبنى رقم 4, ساحة إعمار دبي
وسط مدينة دبي، ص.ب: 65777،
دبي، الإمارات العربية المتحدة -
Abu Dhabi
27th Floor, Office 2701,
Shining Towers, Abu Dhabi, UAE -
Sharjah
29th Floor, Office 2905,
The Business Tower, Sharjah, UAE - +971 (4) 356 2800
- info@century.ae

Century Financial is the presenting sponsor of

ينطوي التداول في المنتجات المالية على مخاطر كبيرة. فالاعتماد على المشتقات المالية المتاحة للتداول خارح البورصة، مثل عقود الفروقات وتداول العملات الأجنبية (الفوركس) الفوري، قد يتسبب في خسائر تتجاوز قيمة الإيداعات الأولية، مما يجعلها غير ملائمة لجميع المستثمرين. فهذه الأدوات المالية المعقدة لا تمنح ملكية مباشرة للأصول الأساسية. لذا، ينبغي للمستثمرين الاحتراز عند تحديد أهدافهم الاستثمارية ومراعاة مستوى المخاطرة المتوقَع، واللجوء إلى الاستشارة المهنية المتخصصة عند الضرورة.
سنشري للإستشارات والتحليل المالي ش.ذ.م.م (الشركة)، شركة مرخّصة ومنظمة من هيئة الأوراق المالية والسلع في دولة الإمارات العربية المتحدة، بموجب الترخيص رقم (20200000028) و(301044) لتولي أعمال الوساطة في الأسواق الدولية، وتداول المشتقات المالية والعملات المتاحة للتداول خارج البورصة في سوق التداول الفوري، بالإضافة إلى تقديم الخدمات الاستشارية والترويجية. تأسست الشركة بموجب قوانين دولة الإمارات العربية المتحدة، وهي مسجلة لدى دائرة التنمية الاقتصادية بدبي (رقم: 768189)، حيث يقع مكتبها المسجّل في 601، الطابق السادس، المبنى رقم 4، ميدان إعمار، وسط مدينة دبي، دولة الإمارات العربية المتحدة، ص.ب. 65777.
لا يُعرَض محتوى هذا الموقع الإلكتروني إلا لأغراض تعريفية تثقيفية بحتة، فلا يمثل عرضًا ولا توصيةً ولا دعوةً لشراء أو بيع أي أوراق مالية أو منتجات مالية.
لا تنوي الشركة استخدام أو توزيع منتجاتها وخدماتها في أي ولاية قضائية حيث يُشكِّل هذا الاستخدام أو التوزيع انتهاكًا للقوانين المحلية أو اللوائح التنظيمية.
