 Loading ...

Tuesday, July 14, 2026
Understanding Bullish Candlestick Patterns in Technical Analysis and Trading
By Century Financial in 'Blog'


One of the most effective technical analysis tools for understanding market sentiment and price fluctuations is the candlestick chart. Bullish candlestick patterns are among the most important chart formations for identifying potential upward trends and lucrative entry points. After a period of selling pressure, these patterns help traders determine whether buyers are regaining control.
Whether trading stocks, currencies, or commodities like oil and gold, recognizing the best bullish candlestick patterns can significantly improve trading strategies.
What Are Bullish Candlestick Patterns?
Bullish candlestick patterns are technical chart formations that signal a potential upward price movement. Each candlestick on a chart represents a specific time period and contains important price data that traders use to understand market behavior.
Key components of a bullish candlestick chart include:
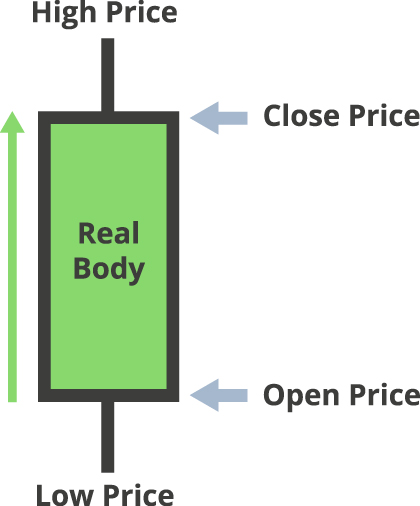
When the closing price is higher than the opening price, the candlestick becomes bullish. This indicates that buyers were stronger during that trading period.
Main Characteristics of Bullish Candlestick Patterns
- Buying pressure exceeds selling pressure
- The closing price is higher than the opening price
- Often appear after a downtrend
- Signal possible market reversal or continuation
Structure of a Bullish Candlestick
| Element | Description |
|---|---|
| Open | Price where the trading period starts |
| Close | Price at which the trading period ends |
| High | The highest price reached during the trading period |
| Low | Lowest price reached during the trading period |
| Body | Distance between the open and close price |
| Wicks or Shadows | Upper and lower price extremes showing volatility |
By analyzing these elements together, traders can better interpret market psychology and identify potential trading opportunities.
Best Bullish Candlestick Patterns Traders Should Know
There are several bullish candlestick patterns that traders commonly use to identify buying opportunities. Below are some of the top bullish candlestick patterns widely used in trading.
Hammer Pattern
The hammer pattern is one of the most recognized reversal bullish candlestick patterns. It usually appears after a strong downtrend and signals that buyers are stepping into the market.
Characteristics of the hammer pattern include:
- Small body near the top of the candle
- Long lower shadow
- Little or no upper shadow
- Forms after a downward price movement
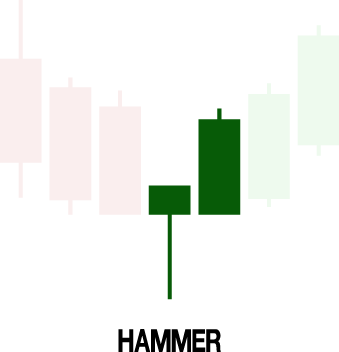
The long lower shadow indicates that sellers initially pushed prices lower, but buyers regained control and pushed prices back up before the candle closed.
Bullish Engulfing Pattern
The bullish engulfing pattern is considered one of the strongest bullish candlestick patterns in technical analysis.
This pattern looks like:
- It consists of two candles
- The first candle is bearish
- The second candle is bullish and completely covers the previous candle's body
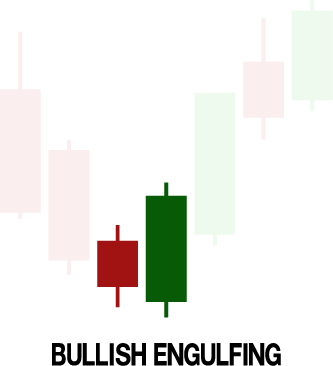
Traders often use this pattern to identify potential entry points in the share market and forex trading.
Morning Star Pattern
The morning star pattern is a three-candle formation that indicates a strong trend reversal.
Structure of the pattern is as follows:
- First comes a large bearish candle
- The second one has a small body showing market indecision
- The third candle is a strong bullish candle
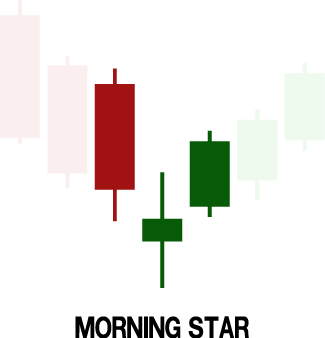
This pattern indicates that selling momentum is weakening and buyers are beginning to dominate the market.
Elevate your trading experience with
Century Trader App
Elevate your trading experience with
Century Trader App

Strong Bullish Candlestick Patterns for Reversal Signals
Traders often focus on strong bullish candlestick patterns that signal a potential change in market direction. Reversal bullish candlestick patterns provide early signals that the market may shift from bearish to bullish.
Key reversal patterns used by traders are:
- Hammer
- Bullish engulfing pattern
- Morning star pattern
- Three white soldiers
Visual Structure of a Reversal Setup
- Price decline
- Support level reached
- Bullish candlestick patterns form
- Buying volume increases
- Price moves upward
Conclusion
Bullish candlestick patterns remain one of the most effective tools for understanding price action and identifying trading opportunities across markets and asset classes like CFDs. By learning the meanings of bullish candlestick patterns and studying formations such as the hammer, bullish engulfing, and morning star, traders can gain deeper insights into potential trend reversals.
However, successful trading requires more than pattern recognition. Traders should combine candlestick analysis with technical indicators, support and resistance levels, and strong risk management strategies with a robust trading platform like Century Trader. Whether trading in the share market, participating in forex trading, or exploring commodities such as gold and oil, traders can use professional platforms to enhance their strategies.
Frequently Asked Questions
Q1: What are bullish candlestick patterns?
A: Bullish candlestick patterns are chart formations that indicate a potential upward price movement. They appear when buying pressure increases and may signal a trend reversal or continuation of an uptrend.
Q2: Which are the best bullish candlestick patterns?
A: Some of the best bullish candlestick patterns include the hammer, bullish engulfing, morning star, piercing line, and three white soldiers. These patterns are commonly used to identify potential buying opportunities.
Q3: Do bullish candlestick patterns work in forex and crypto trading?
A: Yes, bullish candlestick patterns used by forex traders are also effective in crypto and stock markets. However, traders should confirm signals with technical indicators due to higher market volatility.
Q4: How reliable are bullish candlestick patterns?
A: Their reliability depends on the market context. Patterns formed near strong support levels with high trading volume tend to produce stronger signals.
Q5: Can beginners use bullish candlestick patterns?
A: Yes, beginners can learn bullish candlestick patterns easily because they are visually simple. With practice, traders can combine them with indicators to improve trading accuracy.
This marketing and educational content has been created by Century Financial Consultancy LLC (“Century”) for general information only. It does not constitute investment, legal, tax, or other professional advice, nor does it constitute a recommendation, offer, or solicitation to buy or sell any financial instrument. The material does not take into account your investment objectives, financial situation, or particular needs.
The opinions expressed by the hosts, speakers, or guests are their own and may change without notice. Information is based on sources we consider to be reliable; however, Century does not guarantee its accuracy, completeness, or timeliness and accepts no liability for any loss arising from reliance on this content.
Trading and investing involve significant risk, and losses may exceed initial deposits. Past performance is not indicative of future results. CFDs and other leveraged products are complex instruments that may not be suitable for all investors. Please ensure you understand how these products work, the associated risks, and seek independent professional advice if necessary.
Century is licensed and regulated by the UAE Capital Market Authority (CMA) under License Nos. 20200000028 and 301044.
Please refer to the full risk disclosure mentioned on our website.




Regulated by CMA
Century Financial Consultancy LLC








Reach us:
-
Dubai
6th Floor, Emaar Square Building 4,
Downtown, Dubai, P.O. Box 65777,
Dubai, United Arab Emirates -
Abu Dhabi
27th Floor, Office 2701,
Shining Towers, Abu Dhabi, UAE -
Sharjah
29th Floor, Office 2905,
The Business Tower, Sharjah, UAE - +971 (4) 356 2800
- info@century.ae

Disclaimer: Trading in financial products carries substantial risk. Leveraged over-the-counter (OTC) derivatives, such as Contracts for Difference (CFDs) and spot forex, may result in losses exceeding initial deposits and may not be suitable for all investors. These complex instruments do not confer ownership of the underlying assets. Investors should carefully consider their investment objectives and risk appetite, and seek independent professional advice if necessary.
Century Financial Consultancy LLC (CFC) is licensed and regulated by the Capital Market Authority (CMA) of the UAE under license numbers 20200000028 and 301044 to carry out the activities of Financial Products dealer, Trading Broker in international markets, Trading Broker of OTC derivatives and currencies in the spot market, Introduction, Financial Consultations, and Promotion. CFC is incorporated under UAE law, registered with the Dubai Economic Department (No. 768189), with its office at 601, Level 6, Building No. 4, Emaar Square, Downtown Dubai, UAE, PO Box 65777.
The content on this website is provided solely for informational and educational purposes and does not constitute an offer, recommendation, or solicitation to buy or sell any securities or financial products.
Products and services offered by CFC are not intended for use in any jurisdiction where such use or distribution would breach local laws or regulatory requirements.
⚠️ Alert: Fraudulent Activity Notice
Century Financial Consultancy LLC (“Century”) has become aware of fraudulent individuals and entities impersonating our firm through unofficial websites, social media channels, and messaging applications such as Telegram, WhatsApp, and Discord.
Please be advised:
- Century does not manage investments on behalf of clients.
- Century does not solicit funds or guarantee investment returns.
- Century does not accept or make payments in cash, cryptocurrency, or digital assets.
- We do not conduct business via social media or messaging platforms.
Our only official website is www.century.ae, and all communication is conducted exclusively through verified channels.
We strongly urge the public to remain vigilant, verify the authenticity of any communication claiming to be from Century, and report any suspicious activity. Century disclaims any responsibility for losses arising from dealings with unauthorised or fraudulent parties.
