.jpg)
What is a Doji Candlestick?
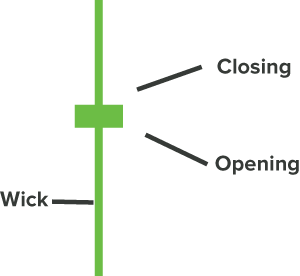
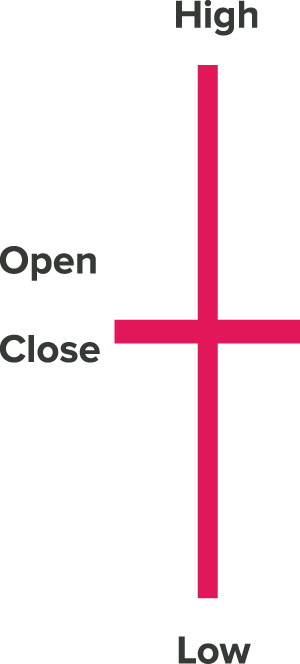
A Doji candlestick is a technical analysis pattern that forms when an asset's opening and closing prices are nearly identical, resulting in a candle with a very thin or nonexistent body. It signifies market indecision, where neither buyers nor sellers have gained control — creating a potential inflection point in price movement.
In charts, the doji candle resembles a cross, plus sign, or inverted T, depending on the position of its upper and lower shadows (wicks). Though small in appearance, its presence can carry strong implications, especially at the end of a trend.
Understanding the Psychology Behind a Doji

This stalemate hints that momentum may be weakening — a crucial insight for traders watching for reversals, pauses, or continuations.
Doji Candle vs Other Candlestick Patters
While the doji candlestick is characterized by a near-zero body, it is distinct from other small-bodied candles like:

Spinning tops:
Small body with longer shadows, but the close and open are not equal.

Marubozu candles:
Full-bodied candles with no wicks, indicating decisive movement.

Hammer or shooting star:
Small body with a single dominant wick, indicating potential reversal.
The doji stands apart because it reflects pure indecision, which can be powerful when combined with trend analysis.
Types of Doji Candlesticks
Doji patterns vary based on the length and placement of their shadows. Each type sends a slightly different message:
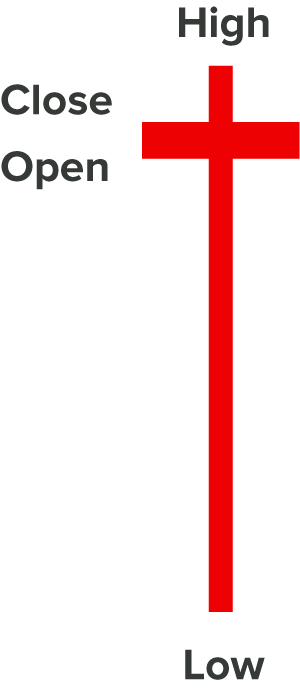
1. Standard Doji:
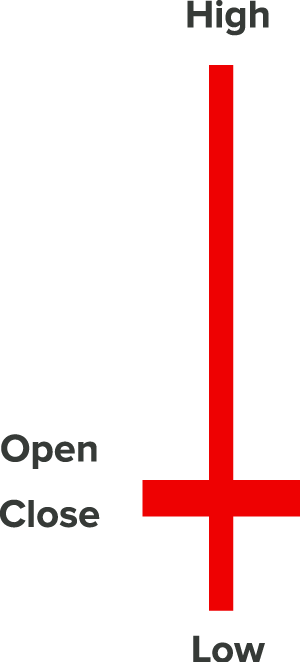
2. Gravestone Doji:
3. Dragonfly Doji
4. Long-Legged Doji
5. Four-Price Doji:

Interpreting Doji Candles in Different Market Contexts
A doji's significance changes based on where it appears in the trend:
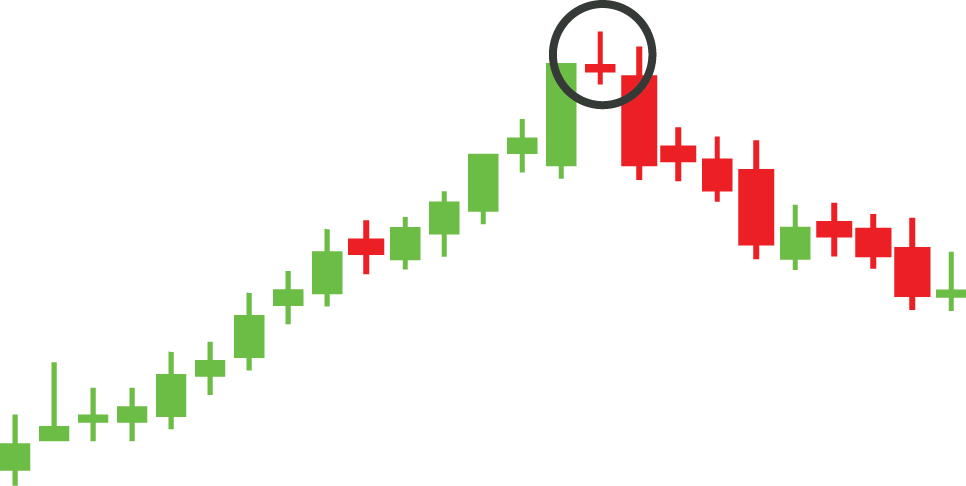
After an Uptrend
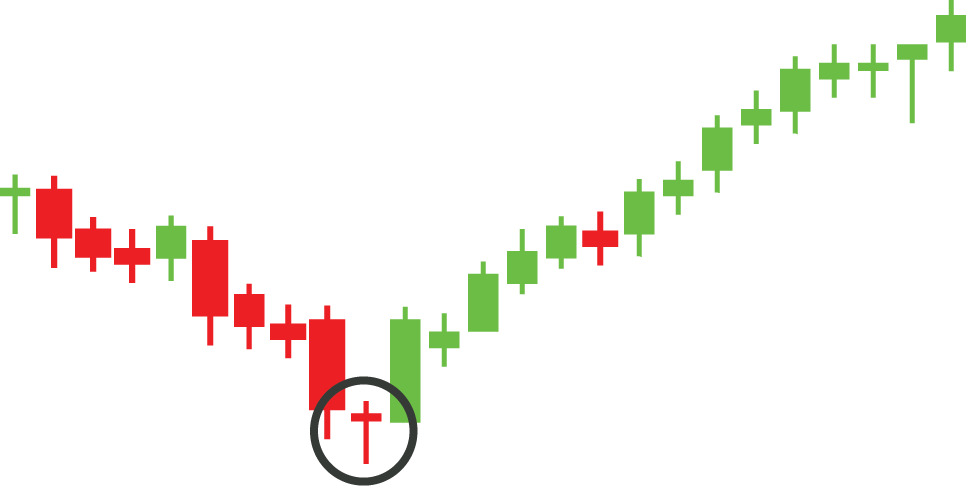
After a Downtrend
In Ranging Markets
How to Trade the Doji Candlestick
A doji by itself is not a trading signal — it’s a clue. The right way to trade it is in context, with supporting indicators and patterns.
Doji Trading Strategy

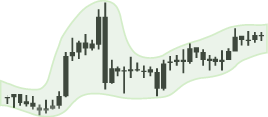
Identify the trend:
Use a 50-day or 200-day moving average to determine trend direction.
Spot the doji:
Preferably at support/resistance or after a strong move.

Look for confirmation:
Next candle should break in the expected direction (bullish or bearish).

Check volume:
A doji with high volume adds more credibility.

Set stop-loss:
Just outside the doji’s wick to limit risk.
Define take-profit:
Use Fibonacci levels, recent swing highs/lows, or ATR multiples.
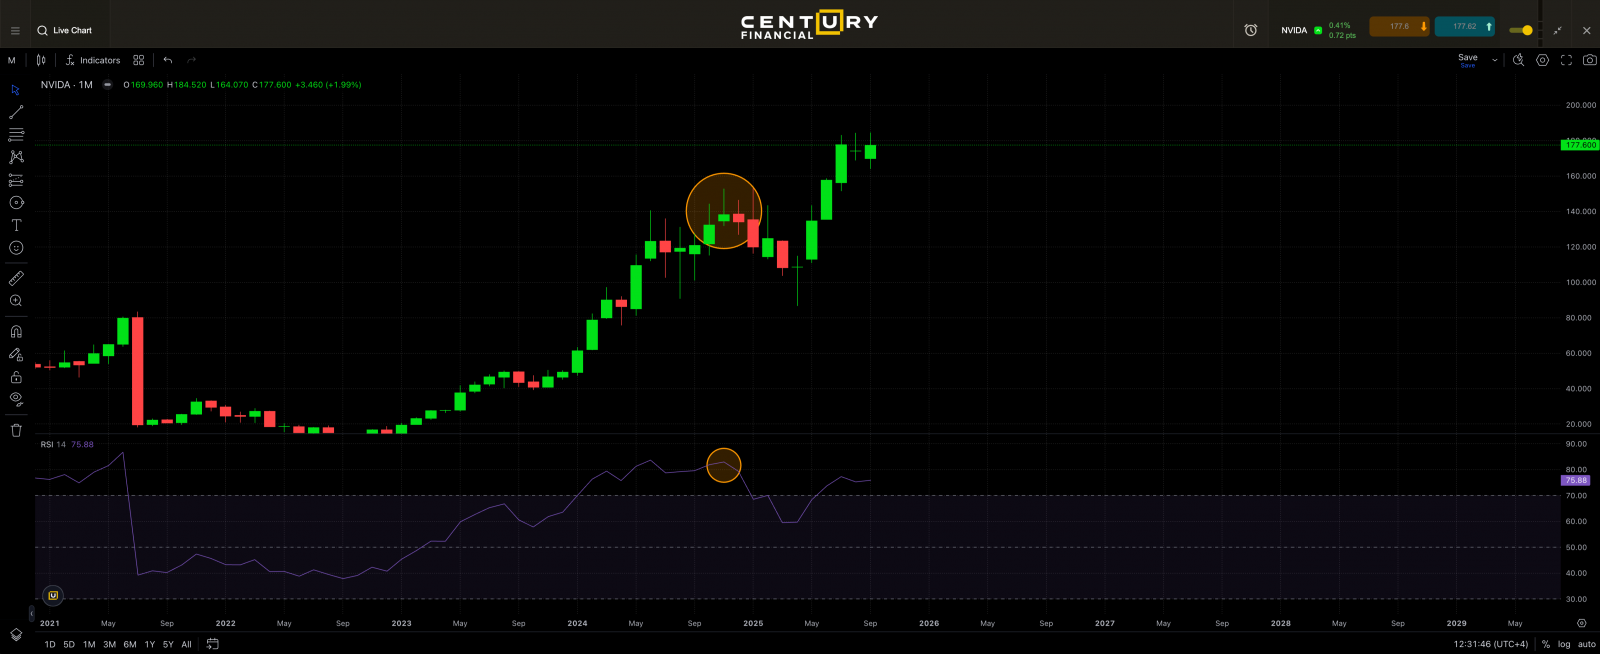
Example:
A gravestone doji appears at a multi-month high in Nvidia’s stock with declining RSI. The next candle is a strong bearish engulfing. This could be a signal to initiate a short trade with a stop-loss above the doji's high.
Doji with Indicators: Enhancing Accuracy
Doji candles become much more powerful when confirmed by technical indicators:
RSI (Relative Strength Index):
Overbought/oversold zones give directional bias.
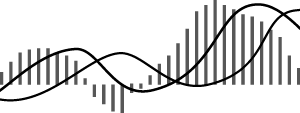
MACD crossover:
Momentum shift confirmation.
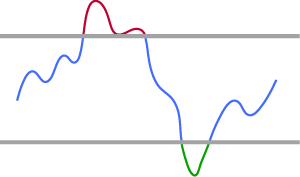
Bollinger Bands:
A doji touching the upper/lower band often precedes a reversal.
Volume Spike:
Indicates strong participation behind indecision.
Common Mistakes When Using Doji Patterns
Successful traders combine doji candles with market context, price action, and confirmations for consistent results.
Doji Candles in Different Asset Classes
Forex
Stocks
Commodities
Crypto
Advanced Concepts: Doji Star Formations
Morning Doji Star
Evening Doji Star
These are powerful multi-candle setups that traders use for confirmation before entry.
FAQs About Doji Candlesticks
Q1. What does a doji candlestick indicate?
A: It indicates market indecision — where buyers and sellers are evenly matched.
Q2: Is a doji candle bullish or bearish?
A: It can be either. The market context and following candle determine the sentiment.
Q3: Are doji candles reliable in intraday trading?
A: Yes, but only when used with volume, trend direction, and quick confirmation.
Q4. How accurate is the doji candle in predicting reversals?
A: It improves accuracy when supported by technical tools like RSI, MACD, or chart patterns.
Q5. Can you use doji in automated strategies?
A: Yes, many algorithmic systems include doji detection as part of reversal or momentum filters.
This marketing and educational content has been created by Century Financial Consultancy LLC (“Century”) for general information only. It does not constitute investment, legal, tax, or other professional advice, nor does it constitute a recommendation, offer, or solicitation to buy or sell any financial instrument. The material does not take into account your investment objectives, financial situation, or particular needs.
The opinions expressed by the hosts, speakers, or guests are their own and may change without notice. Information is based on sources we consider to be reliable; however, Century does not guarantee its accuracy, completeness, or timeliness and accepts no liability for any loss arising from reliance on this content.
Trading and investing involve significant risk, and losses may exceed initial deposits. Past performance is not indicative of future results. CFDs and other leveraged products are complex instruments that may not be suitable for all investors. Please ensure you understand how these products work, the associated risks, and seek independent professional advice if necessary.
Century is licensed and regulated by the UAE Capital Market Authority (CMA) under License Nos. 20200000028 and 301044.
Please refer to the full risk disclosure mentioned on our website.


Regulated by CMA
Century Financial Consultancy LLC


.png)
.png)
.png)
.png)


Reach us:
-
Dubai
6th Floor, Emaar Square Building 4,
Downtown, Dubai, P.O. Box 65777,
Dubai, United Arab Emirates -
Abu Dhabi
27th Floor, Office 2701,
Shining Towers, Abu Dhabi, UAE -
Sharjah
29th Floor, Office 2905,
The Business Tower, Sharjah, UAE - +971 (4) 356 2800
- info@century.ae

Disclaimer: Trading in financial products carries substantial risk. Leveraged over-the-counter (OTC) derivatives, such as Contracts for Difference (CFDs) and spot forex, may result in losses exceeding initial deposits and may not be suitable for all investors. These complex instruments do not confer ownership of the underlying assets. Investors should carefully consider their investment objectives and risk appetite, and seek independent professional advice if necessary.
Century Financial Consultancy LLC (CFC) is licensed and regulated by the Capital Market Authority (CMA) of the UAE under license numbers 20200000028 and 301044 to carry out the activities of Financial Products dealer, Trading Broker in international markets, Trading Broker of OTC derivatives and currencies in the spot market, Introduction, Financial Consultations, and Promotion. CFC is incorporated under UAE law, registered with the Dubai Economic Department (No. 768189), with its office at 601, Level 6, Building No. 4, Emaar Square, Downtown Dubai, UAE, PO Box 65777.
The content on this website is provided solely for informational and educational purposes and does not constitute an offer, recommendation, or solicitation to buy or sell any securities or financial products.
Products and services offered by CFC are not intended for use in any jurisdiction where such use or distribution would breach local laws or regulatory requirements.
⚠️ Alert: Fraudulent Activity Notice
Century Financial Consultancy LLC (“Century”) has become aware of fraudulent individuals and entities impersonating our firm through unofficial websites, social media channels, and messaging applications such as Telegram, WhatsApp, and Discord.
Please be advised:
- Century does not manage investments on behalf of clients.
- Century does not solicit funds or guarantee investment returns.
- Century does not accept or make payments in cash, cryptocurrency, or digital assets.
- We do not conduct business via social media or messaging platforms.
Our only official website is www.century.ae, and all communication is conducted exclusively through verified channels.
We strongly urge the public to remain vigilant, verify the authenticity of any communication claiming to be from Century, and report any suspicious activity. Century disclaims any responsibility for losses arising from dealings with unauthorised or fraudulent parties.
