Friday, September 26, 2025
Understanding Earnings Per Share (EPS): A Complete Guide for Traders
By Century Financial in 'Blog'

Introduction: Why EPS Matters for Investors & Traders
Earnings Per Share (EPS) is one of the most widely used metrics in the financial world. It directly connects a company’s profitability with the value received by each shareholder. Investors rely on EPS to measure how efficiently a company generates profit from its equity. On the other hand, traders use it to identify potential stock price movements around quarterly earnings announcements.
A strong and growing EPS often signals financial stability. Long-term investors are drawn to stocks with stable and high EPS. Whereas fluctuations in EPS can create short-term trading opportunities.
Even when a company reports negative earnings per share, it provides crucial insights into its financial challenges and possible recovery scenarios. For anyone engaged in stock market investment, understanding the EPS of a share becomes essential since it helps in comparing companies within the same industry and making informed buy or sell decisions.
What Is Earnings Per Share (EPS)? Formula & Basics
Definition Of Earnings Per Share -
Earnings Per Share (EPS) represents the portion of a company’s net profit allocated to each
outstanding share of common stock. It is a key profitability metric that helps investors
assess how much income a company generates for its shareholders.
In simple terms, EPS helps investors quantify the profitability of a share, thereby giving
an estimate of how the company is doing. And, since historical data forms a strong basis for
decision-making in markets, Earnings Per Share (EPS) gives a dependable fundamental basis
for investment decisions.

Why EPS Is Important:
Why Weighted Average Shares Matter
The number of outstanding shares can change frequently due to buybacks, new share issuances, stock splits, or the issuance of employee stock options. These fluctuations make the number of shares available on any particular date an unreliable figure. That’s why analysts rely on weighted average shares—it accounts for the timing of share changes across the reporting period, ensuring a more accurate EPS calculation.
Real-World Example
Let’s look at Apple Inc.(AAPL). In its quarterly results, Apple reported net income of approximately USD 23 billion with around 15.5 billion diluted shares outstanding. This produced an EPS of about USD 1.48. It is advised to closely track such figures because even a small EPS beat or miss against analyst expectations can significantly move the stock price.
Similarly, if a company reports a negative earnings per share (e.g., –USD 2.00), it indicates the company incurred losses during the reporting period. The impact will be a decline in investor confidence and share price volatility.
Other variants of Earnings Per Share include Cash EPS, Book Value EPS, and Retained EPS, each offering different perspectives.
Definition Of Earnings Per Share - When EPS Is Negative: What It Means for Traders
As mentioned before, a negative earnings per share result suggests that the company was going through a loss-making period. This situation can adversely affect valuation and investor confidence, particularly when using EPS to compare companies or assess price-to-earnings (P/E) ratios. Therefore, it is suggested to combine EPS analysis with other financial metrics and forward-looking data, especially in volatile markets.
Valuation via P/E Ratio
EPS is the “E” in the P/E ratio, guiding how much investors are willing to pay per dollar of earnings.
Comparative Benchmarking
Comparing EPS across peers or periods helps identify growth or value opportunities.
Trading Strategy Insight
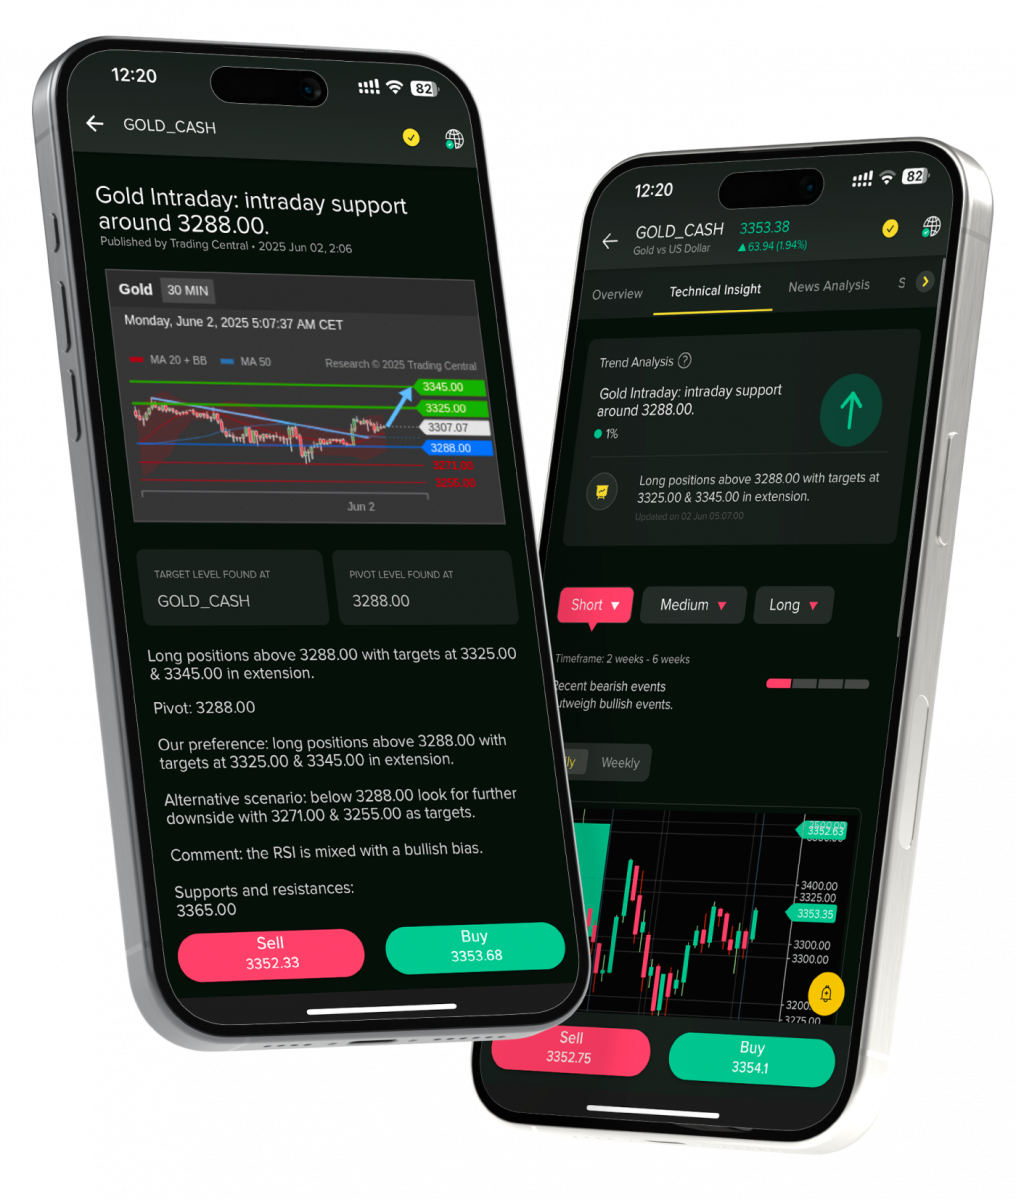
Platforms like Century Trader App, MT5, CQG, and TWS enable you to monitor EPS reports and trends—integral for timing entries into shares, indices, ETFs, commodities, CFDs, and more.
How Century Financial Empowers You with EPS Insight
Century Financial, a trusted SCA-regulated UAE broker, offers over 5,000 instruments and robust platforms like Century Trader App, MT5, CQG, and TWS.
FAQs
Q1. What is a good EPS growth rate for a stock?
A: There are no fixed figures. A "good" EPS varies by industry, but consistent upward trends generally indicate healthy fundamentals and may attract investor attention in regulated platforms like those offered by Century Financial.
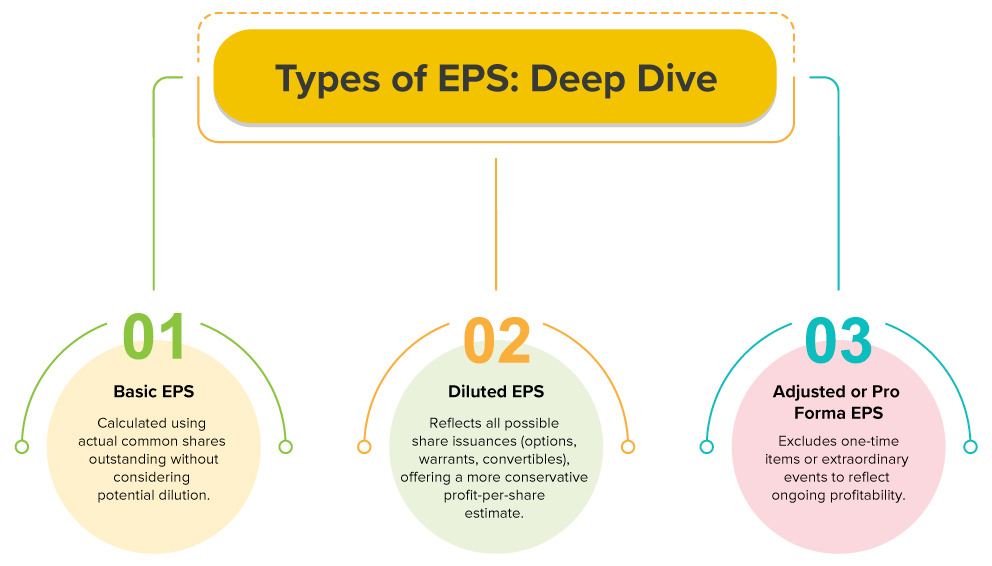
Q2: How does diluted EPS differ from basic EPS?
A: Basic EPS uses current shares outstanding, while diluted EPS includes all potential shares from convertible instruments—typically producing a lower, more conservative figure.
Q3: Can EPS be manipulated?
A: Yes, companies may reduce outstanding shares via buybacks to elevate EPS. That’s why it’s vital to consider context, such as cash flow and dilution risks.
Q4. What does negative EPS indicate?
A: It signifies a net loss during the period and may warrant caution, especially if recurring, though it can also highlight potential turnaround opportunities.
Q5. How do I use EPS data on Century Financial’s trading platforms?
A: Use integrated tools like real-time alerts, chart overlays, and research resources to monitor and act upon EPS reports across your trading instruments.
Conclusion
Earnings Per Share (EPS) as a metric has multifaceted uses and benefits. Hence, it remains one of the most critical indicators for evaluating a company’s profitability and investment potential. From basic earnings per share to understanding scenarios where earnings per share are negative, EPS offers traders and investors a reliable benchmark for comparing stocks, analyzing financial health, and building effective trading strategies.
Put EPS into Practice with Century Financial
Ready to translate EPS insights into actionable trades?
Register with Century Financial to explore live EPS data across MT5, Century Trader App, CQG, or TWS.
Test your strategies using shares, ETPs, CFDs, currencies, indices, and commodities.
Access expert research, live news, and technical tools — all designed to help you leverage EPS trends for better stock market investment outcomes.
This marketing and educational content has been created by Century Financial Consultancy LLC (“Century”) for general information only. It does not constitute investment, legal, tax, or other professional advice, nor does it constitute a recommendation, offer, or solicitation to buy or sell any financial instrument. The material does not take into account your investment objectives, financial situation, or particular needs.
The opinions expressed by the hosts, speakers, or guests are their own and may change without notice. Information is based on sources we consider to be reliable; however, Century does not guarantee its accuracy, completeness, or timeliness and accepts no liability for any loss arising from reliance on this content.
Trading and investing involve significant risk, and losses may exceed initial deposits. Past performance is not indicative of future results. CFDs and other leveraged products are complex instruments that may not be suitable for all investors. Please ensure you understand how these products work, the associated risks, and seek independent professional advice if necessary.
Century is licensed and regulated by the UAE Capital Market Authority (CMA) under License Nos. 20200000028 and 301044.
Please refer to the full risk disclosure mentioned on our website.


__1439480927.jpg)

Regulated by SCA
Century Financial Consultancy LLC


.png)
.png)
.png)
.png)


Reach us:
-
Dubai
6th Floor, Emaar Square Building 4,
Downtown, Dubai, P.O. Box 65777,
Dubai, United Arab Emirates -
Abu Dhabi
27th Floor, Office 2701,
Shining Towers, Abu Dhabi, UAE -
Sharjah
29th Floor, Office 2905,
The Business Tower, Sharjah, UAE - +971 (4) 356 2800
- info@century.ae

Disclaimer: Trading in financial products carries substantial risk. Leveraged over-the-counter (OTC) derivatives, such as Contracts for Difference (CFDs) and spot forex, may result in losses exceeding initial deposits and may not be suitable for all investors. These complex instruments do not confer ownership of the underlying assets. Investors should carefully consider their investment objectives and risk appetite, and seek independent professional advice if necessary.
Century Financial Consultancy LLC (CFC) is licensed and regulated by the Capital Market Authority (CMA) of the UAE under license numbers 20200000028 and 301044 to carry out the activities of Financial Products dealer, Trading Broker in international markets, Trading Broker of OTC derivatives and currencies in the spot market, Introduction, Financial Consultations, and Promotion. CFC is incorporated under UAE law, registered with the Dubai Economic Department (No. 768189), with its office at 601, Level 6, Building No. 4, Emaar Square, Downtown Dubai, UAE, PO Box 65777.
The content on this website is provided solely for informational and educational purposes and does not constitute an offer, recommendation, or solicitation to buy or sell any securities or financial products.
Products and services offered by CFC are not intended for use in any jurisdiction where such use or distribution would breach local laws or regulatory requirements.
⚠️ Alert: Fraudulent Activity Notice
Century Financial Consultancy LLC (“Century”) has become aware of fraudulent individuals and entities impersonating our firm through unofficial websites, social media channels, and messaging applications such as Telegram, WhatsApp, and Discord.
Please be advised:
- Century does not manage investments on behalf of clients.
- Century does not solicit funds or guarantee investment returns.
- Century does not accept or make payments in cash, cryptocurrency, or digital assets.
- We do not conduct business via social media or messaging platforms.
Our only official website is www.century.ae, and all communication is conducted exclusively through verified channels.
We strongly urge the public to remain vigilant, verify the authenticity of any communication claiming to be from Century, and report any suspicious activity. Century disclaims any responsibility for losses arising from dealings with unauthorised or fraudulent parties.
