Thursday, July 02, 2026
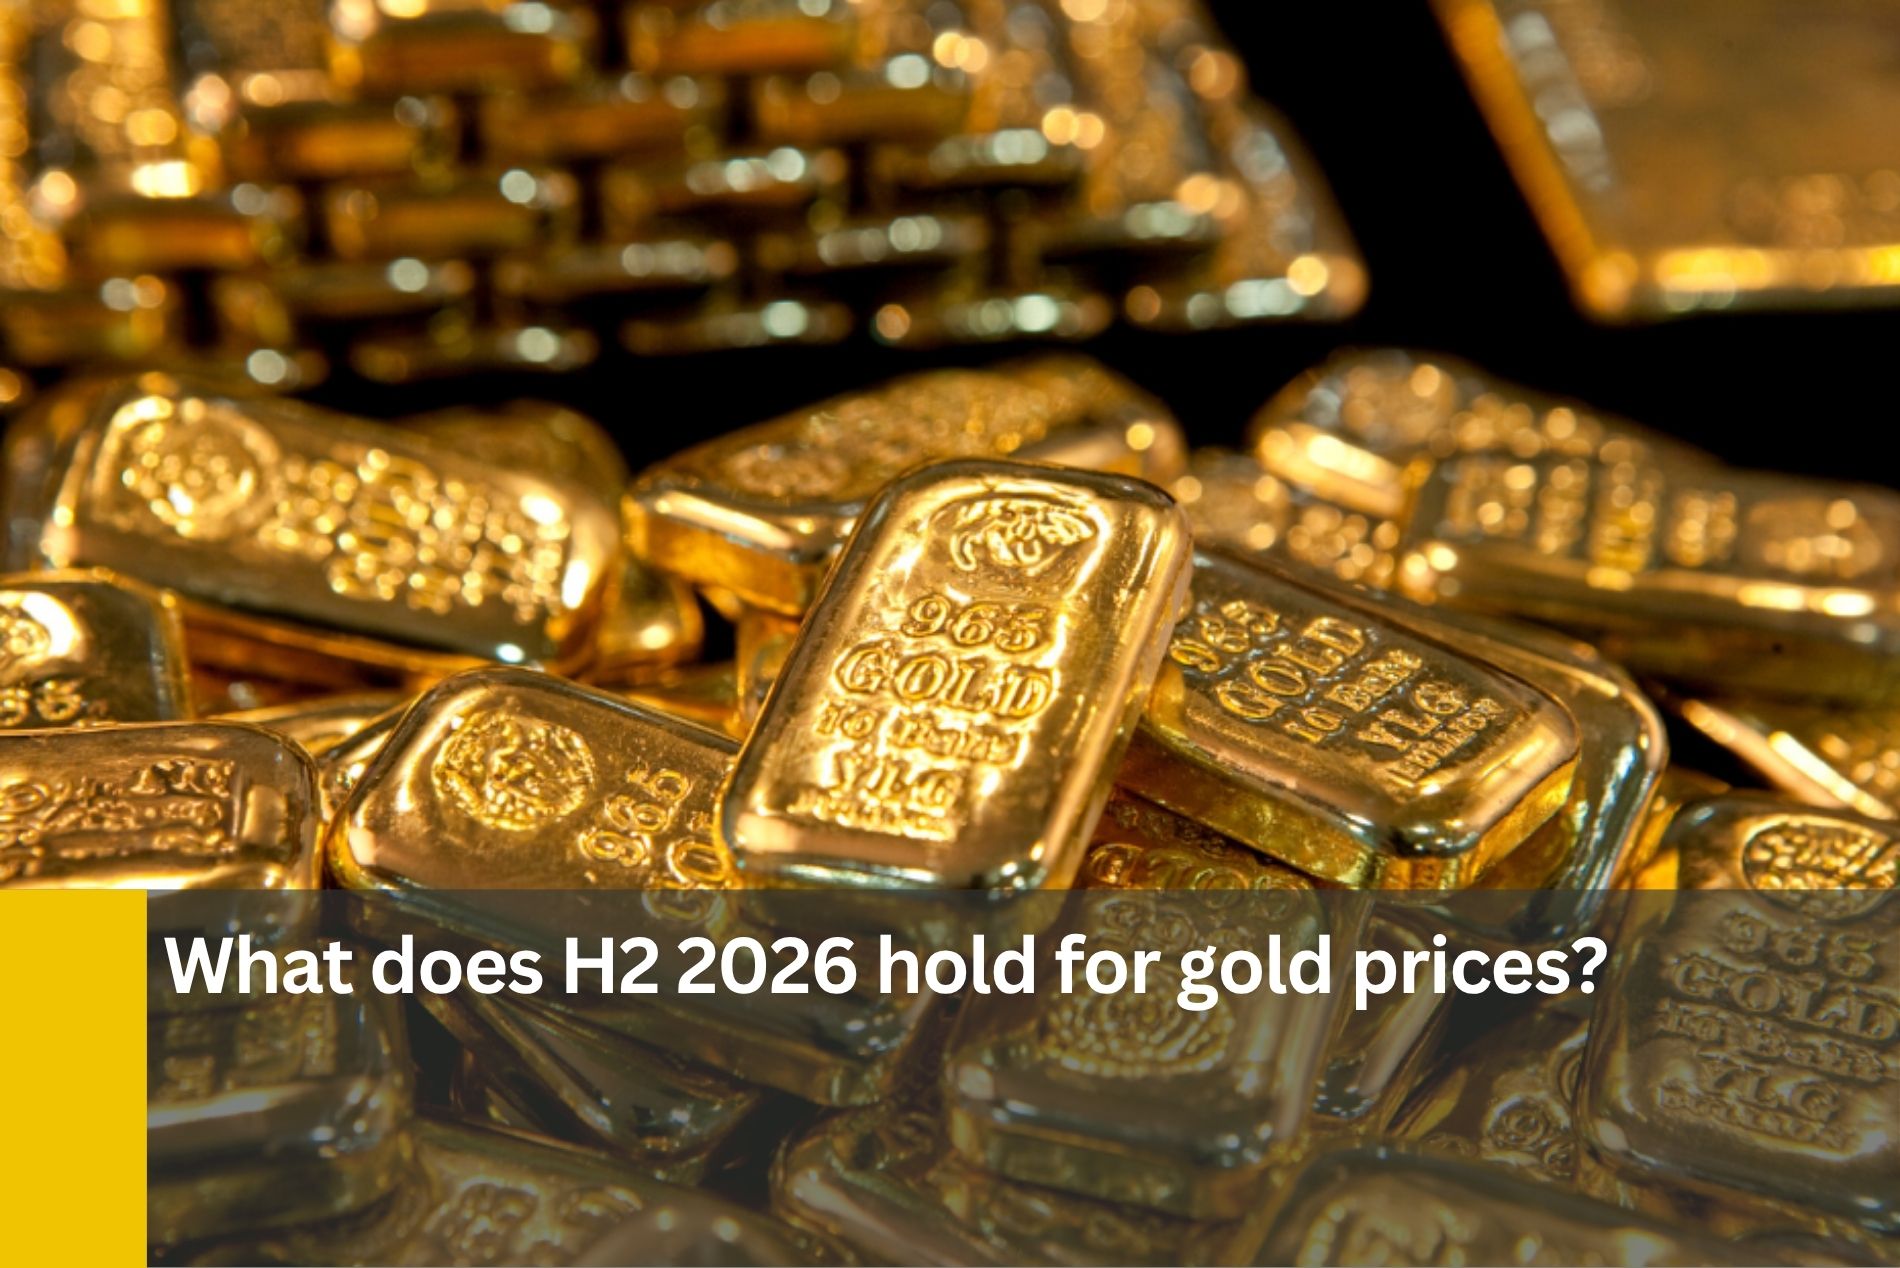
What does H2 2026 hold for gold prices?
By Vijay Valecha in 'Century in News'
Vijay Valecha, Thur, July 2, 2026 Gulf Business
The precious metal recorded more than 12 all-time highs during the first half of the year, peaking at a record $5,405/oz in late January before retreating sharply to a low
After a volatile opening half to the year, gold enters the second half of 2026 at a critical juncture, with performance increasingly shaped by shifting geopolitical risks, evolving interest rate expectations, and changing investor positioning dynamics, according to the Gold Mid-Year Outlook 2026 released by the World Gold Council.
The precious metal recorded more than 12 all-time highs during the first half of the year, peaking at a record $5,405/oz in late January before retreating sharply to a low of $4,002/oz in June. The swing resulted in a 7 per cent year-to-date decline and a rise in average volatility to 30 per cent. Despite the correction, gold remains among the strongest-performing major asset classes over the past year, underpinned by sustained structural demand.
Volatile first half driven by geopolitics and positioningElevated geopolitical tensions, particularly the US-Iran conflict, emerged as the dominant driver of gold’s performance in the first half of 2026. According to the World Gold Council’s Gold Return Attribution Model (GRAM), price action was also influenced by momentum-driven investor positioning and subsequent profit-taking as markets reacted to shifting macro expectations.
The opportunity cost of holding non-yielding assets such as gold presented a mixed influence, as investors recalibrated expectations around interest rates and US dollar strength. Trading patterns also highlighted a structural shift in global liquidity flows, with a significant proportion of gold’s price discovery occurring during Asian and US trading hours, underscoring the growing influence of Asian investors in global bullion markets.
Macroeconomic signals shape the outlookLooking ahead, the World Gold Council indicates that gold is likely to remain a key barometer of global macroeconomic conditions. Unlike assets driven primarily by domestic fundamentals, gold reflects a synthesis of global demand from consumers, institutional investors, and central banks.
At current levels, the gold price broadly aligns with consensus macro assumptions. These include expectations of at least one Federal Reserve rate hike in 2026, likely by October, alongside parallel tightening cycles from the Bank of England, Bank of Japan, and European Central Bank. Inflation in the United States is projected to peak near 3.9 per cent in the second quarter.
Under these conditions, the World Gold Council suggests gold may trade within a narrow range of approximately ±5 per cent around $4,100/oz through the end of the year, assuming macroeconomic stability persists.
Scenario risks: Upside and downside pressuresThe outlook for gold remains highly sensitive to changes in macro and geopolitical conditions. A deterioration in global growth or renewed escalation in geopolitical risk could reignite upward momentum. However, the World Gold Council notes that a sustained breakout above $4,500/oz would likely require a pronounced global economic slowdown or a significant shift in interest rate expectations.
On the downside, stronger-than-expected US dollar performance, tighter monetary policy than currently priced in, and renewed risk-on sentiment across equity markets represent key headwinds. A sustained break below $4,000/oz could trigger additional downside pressure. However, historical patterns suggest that declines of more than 10% from current levels tend to attract renewed physical and institutional demand across multiple regions, reinforcing gold’s longer-term support base.
Precious metals under pressure amid geopolitical uncertaintyBroader precious metals markets have remained under pressure as renewed US-Iran tensions add to inflationary concerns. Both gold and silver declined by 1–2 per cent in the previous session, reflecting heightened volatility across commodities.
In intraday trading, gold briefly slipped below the $4,000 level before recovering, while silver traded near $59. Market sentiment has been influenced by conflicting diplomatic signals between Washington and Tehran regarding potential negotiations. The US indicated that discussions with Iran are scheduled to begin in Doha, while Iranian officials signalled limited engagement, stating that only a delegation of experts would be sent and ruling out direct talks.
At the same time, a stronger US dollar, supported by a more hawkish Federal Reserve stance, has added pressure on precious metals. Policymakers have indicated willingness to tighten monetary conditions further in response to persistent inflationary pressures. Upcoming US labour data, particularly non-farm payrolls (NFP), are expected to play a key role in shaping near-term policy expectations. A stronger-than-expected reading could reinforce a restrictive policy bias and weigh further on bullion prices.
Investor flows have also weakened, with holdings in bullion-backed exchange-traded funds declining to their lowest levels since September. According to market participants, recent outflows have intensified bearish sentiment. Vijay Valecha, chief investment officer at Century Financial, noted that the previous week alone saw ETF outflows of $4.39bn, equivalent to 36 tonnes, highlighting sustained institutional de-risking.
Technical landscape: Key levels in focusFrom a technical perspective, gold has broken below its descending channel, signalling near-term weakness and increased sensitivity to key resistance levels. Immediate resistance is seen between $4,070 and $4,100, a zone reinforced by the 200-period exponential moving average on the four-hour chart.
A failed retest of this range could present renewed downside pressure, with potential targets near the $4,000 level. Conversely, a sustained breakout above US$4,100 would shift focus toward the $4,200–$4,250 range, where additional resistance aligns with the 20-day exponential moving average. On the downside, support is expected around $3,930, followed by $3,880.
For silver, resistance is projected in the $61–$62 range, a zone also reinforced by the 50-period EMA on the four-hour chart. A retest of this resistance band may attract selling pressure, with downside targets near $56. Support is expected around $55–$56, consistent with last week’s lows, according to Valecha.
Source
__265045312.jpg)
__178286007.jpg)
__61131252.jpg)

Regulated by CMA
Century Financial Consultancy LLC


.png)
.png)
.png)
.png)
.png)

Reach us:
-
Dubai
6th Floor, Emaar Square Building 4,
Downtown, Dubai, P.O. Box 65777,
Dubai, United Arab Emirates -
Abu Dhabi
27th Floor, Office 2701,
Shining Towers, Abu Dhabi, UAE -
Sharjah
29th Floor, Office 2905,
The Business Tower, Sharjah, UAE - +971 (4) 356 2800
- info@century.ae

Disclaimer: Trading in financial products carries substantial risk. Leveraged over-the-counter (OTC) derivatives, such as Contracts for Difference (CFDs) and spot forex, may result in losses exceeding initial deposits and may not be suitable for all investors. These complex instruments do not confer ownership of the underlying assets. Investors should carefully consider their investment objectives and risk appetite, and seek independent professional advice if necessary.
Century Financial Consultancy LLC (CFC) is licensed and regulated by the Capital Market Authority (CMA) of the UAE under license numbers 20200000028 and 301044 to carry out the activities of Financial Products dealer, Trading Broker in international markets, Trading Broker of OTC derivatives and currencies in the spot market, Introduction, Financial Consultations, and Promotion. CFC is incorporated under UAE law, registered with the Dubai Economic Department (No. 768189), with its office at 601, Level 6, Building No. 4, Emaar Square, Downtown Dubai, UAE, PO Box 65777.
The content on this website is provided solely for informational and educational purposes and does not constitute an offer, recommendation, or solicitation to buy or sell any securities or financial products.
Products and services offered by CFC are not intended for use in any jurisdiction where such use or distribution would breach local laws or regulatory requirements.
⚠️ Alert: Fraudulent Activity Notice
Century Financial Consultancy LLC (“Century”) has become aware of fraudulent individuals and entities impersonating our firm through unofficial websites, social media channels, and messaging applications such as Telegram, WhatsApp, and Discord.
Please be advised:
- Century does not manage investments on behalf of clients.
- Century does not solicit funds or guarantee investment returns.
- Century does not accept or make payments in cash, cryptocurrency, or digital assets.
- We do not conduct business via social media or messaging platforms.
Our only official website is www.century.ae, and all communication is conducted exclusively through verified channels.
We strongly urge the public to remain vigilant, verify the authenticity of any communication claiming to be from Century, and report any suspicious activity. Century disclaims any responsibility for losses arising from dealings with unauthorised or fraudulent parties.
