 Loading ...

Tuesday, August 25, 2026
Commodities and Miners: Back in driving Seat
By Century Financial in 'Investment Insights'


Commodities are back in focus amid a shift in US Treasury debt management. Buybacks of 10-to-30-year debt, funded by short-dated bill issuance, artificially hold long-end yields down. That means fewer long bonds need to clear the market while pushing dollar liquidity into the front end. Real yields on long paper compress, the dollar's carry appeal fades, and the market reads the choice as an acceptance of inflation to protect debt-service costs, penalising cash and bond holders alike. That creates dollar weakness and commodities, which are finite-supply and hard assets, as the natural offset. Weak July payrolls cut September Fed rate-hike odds to 43% from 64%; CPI came in line; and the dollar has eased, providing the tactical trigger to the structural case.
Gold has broken above $4,400/oz, anchored by a 21-month streak of Chinese central bank buying, Q1 2026 net offcial purchases of 244 tonnes, and mine supply forecast to decline at 0.9% CAGR through 2030. Silver enters its sixth consecutive year of deficit, with above-ground stocks down 762 Moz since 2021 and roughly 70% of output tied to byproduct mining, leaving supply structurally unable to respond to price. Copper is set to move into a 280,000-tonne deficit by 2027, widening to 642,000 tonnes by 2030, as electrification, EVs and AI data centres add demand. Platinum's industrial demand is forecast to rise 9% in 2026 to 2.24 million ounces, driven by hydrogen fuel cell and electrolyser adoption.
| Symbol | Prev Month | Last Trade Price $ |
Support 3 $ |
Support 2 $ |
Support 1 $ |
Pivot $ |
Resistance 1 $ |
Resistance 2 $ |
Resistance 3 $ |
|---|---|---|---|---|---|---|---|---|---|
| Gold | 2026-07 | 4,493.51 | 3,825.45 | 3,918.44 | 3,975.89 | 4,068.87 | 4,161.86 | 4,219.31 | 4,312.29 |
| Silver | 2026-07 | 66.948 | 49.943 | 53.190 | 55.196 | 58.443 | 61.690 | 63.696 | 66.943 |
| Copper | 2026-07 | 643.27 | 579.58 | 599.06 | 611.10 | 630.59 | 650.07 | 662.11 | 681.60 |
| Platinum | 2026-07 | 1,799.41 | 1,449.10 | 1,511.29 | 1,549.71 | 1,611.89 | 1,674.08 | 1,712.50 | 1,774.68 |
| Name | Ticker | Primary Exchange Name |
Currency | *Last Price ($) | 52 Week Low ($) |
52 Week High ($) |
NAV ($) | % Premium /Discount |
Beta | Total Assets (in $ billions) |
Expense Ratio (%) |
|---|---|---|---|---|---|---|---|---|---|---|---|
| VANECK GOLD MINERS ETF | GDX | NYSE Arca | USD | 91.89 | 56.59 | 117.18 | 91.79 | 0.11 | 1.01 | 28.57 | 0.51 |
| GLOBAL X SILVER MINERS ETF | SIL | NYSE Arca | USD | 90.72 | 51.93 | 119.24 | 90.62 | 0.11 | 1.01 | 4.91 | 0.65 |
| GLOBAL X COPPER MINERS ETF | COPX | NYSE Arca | USD | 87.34 | 45.96 | 99.99 | 87.68 | -0.38 | 1.02 | 8,043.38 | 0.65 |
*Last Price as of 17th August,2026
Gold
Commodity Outlook
The 11 August break to $4,400/oz is fundamentally supported by tight supply, sticky central-bank demand and a friendlier macro turn. Supply is constrained: 2025 total gold demand (incl. OTC) topped 5,000 tonnes for the first time, with investment at 43.5%, jewellery at 33%, and central banks at 17.3%, while mine production is forecast to decline at a 0.9% CAGR through 2030 as Chinese resources deplete and Chinese/Ghanaian closures land. Central-bank buying is the anchor: net purchases reached 244 tonnes in Q1 2026 on a Gold Demand Trends basis, and reported June buying of 51 tonnes ran well above the 27-tonne monthly average. Poland led H1 with 82 tonnes, and China extended its streak to 21 straight months through July. 89% of respondents in the latest WGC central-bank survey expect global reserves to rise. Macro just turned: weak July US payrolls cut September Fed-hike odds to 43% from 64%; July CPI figures were in line with expectations (good news for risk assets); ETF outflows potentially bottomed and are now seeing inflows, with an added $3 billion; the dollar softened.
Miners as Beneficiaries
Operating leverage is at cycle highs; prefer low-cost seniors. Q2 2026 AISC: Agnico Eagle $1,459/oz, Newmont $1,621, Barrick US$1,866 — versus industry-median ~US$1,709 (WGC/Metals Focus, Q4 2025). At $4,400/oz gold, per-ounce cash margins are at a record ~US$2,500–3,000.
Mine supply is constrained. Global output has held near 3,600 tonnes/year (WGC Gold Demand Trends) and is forecast to decline at 0.9% CAGR through 2030 as Chinese resources deplete and Chinese/Ghanaian closures land, sustaining pricing power for lower-cost producers.
Along with this, capital discipline and pristine balance sheet cash positions support a re-rating from muted multiples.
Technicals
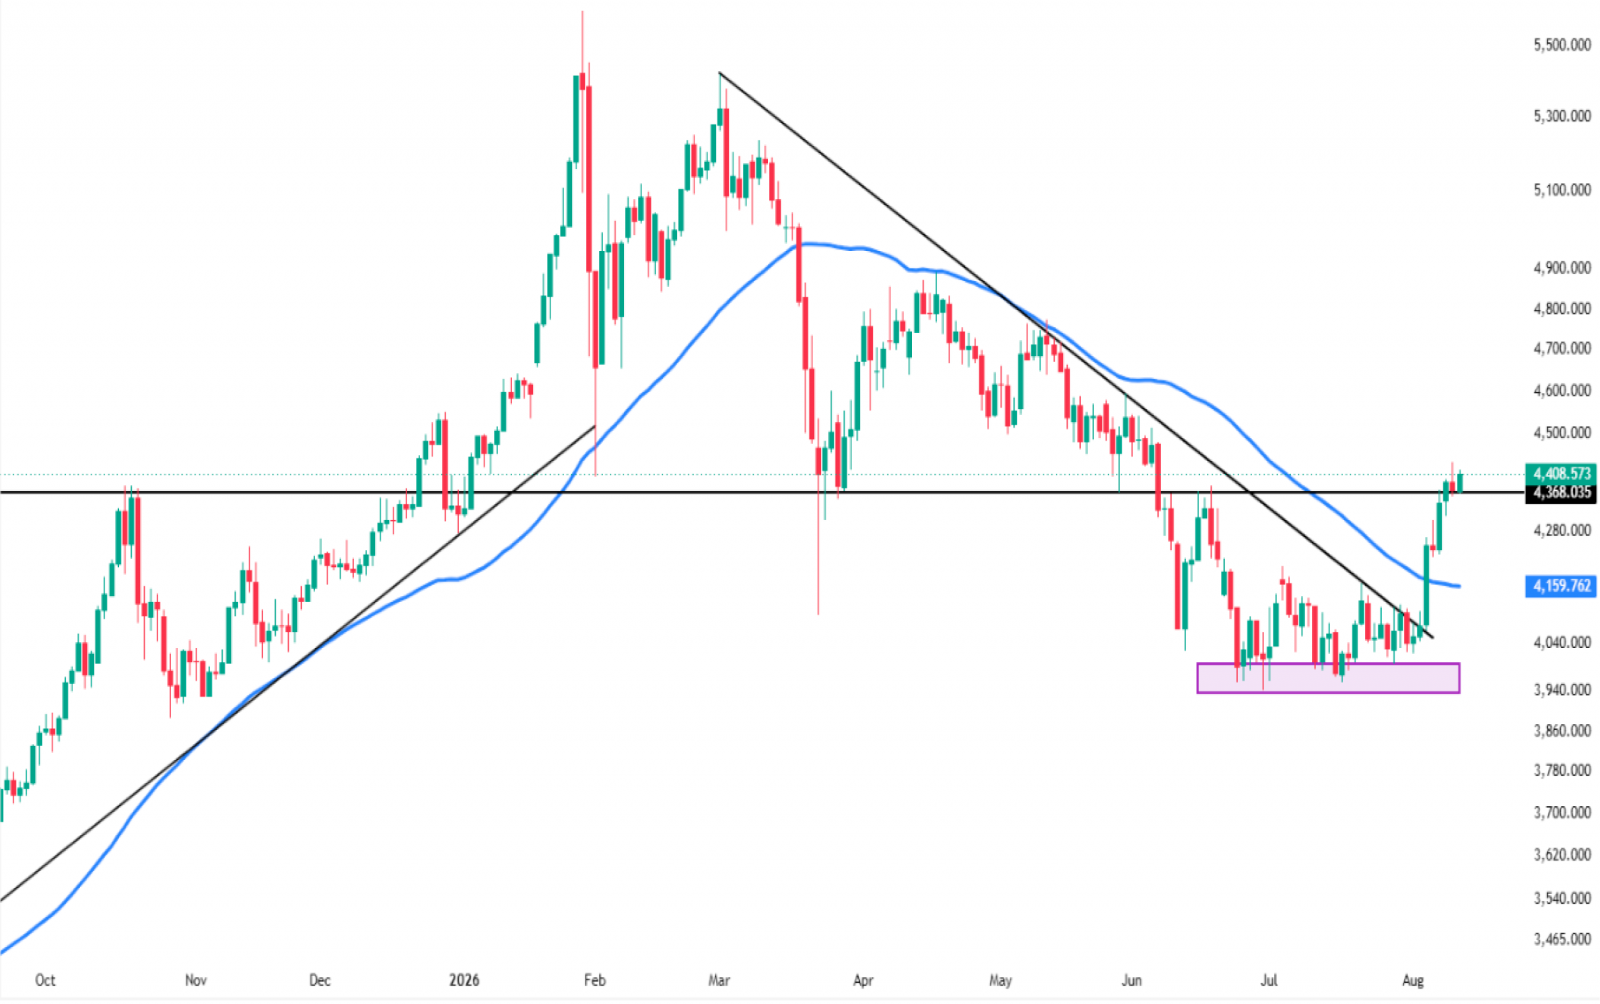
Gold had been basing around $4,000 since mid-June and was trading with resistance from a descending trendline formed since March highs. After the NFP data release and a cooldown in yields and DXY, gold bounced from this zone, broke the descending trendline and rose above the 50-day SMA. This is a strong reversal in trend, with bulls now in control. The break above the horizontal resistance around $4,370 further reinforces the thesis.
Silver
Commodity Outlook
Silver offers a higher-beta way to participate in the precious-metals bull market. At US$66/oz on 12 August, silver has rebounded about 15% from its $55–60 base but remains well below the January peak of $121, leaving the risk-reward attractive. The key driver is the persistent supply deficit. 2026 marks the sixth consecutive year of deficit, at 46.3 Moz (Silver Institute/Metals Focus, WSS 2026). Above-ground stocks have fallen by 762 Moz since 2021, while mine supply is expected to remain flat and total supply to decline 2%. The market is entering an “era of reduced stocks,” as WSS 2026 puts it. Lower inventories mean thinner liquidity, more volatile lease rates and potentially larger price moves. Investment demand is also strengthening. Coin and bar demand is forecast to rise 18% y/y to 257.6 Moz in 2026, its strongest level since 2022. Industrial demand remains resilient at 657 Moz, or roughly 58% of 2025 demand, despite efforts by solar manufacturers to reduce silver usage.
Miners as Beneficiaries
Operating leverage is at record levels: prefer Hecla for cost leadership, Pan American for scale. Q2 2026 silver segment AISC: Hecla $6.07/oz ex-Keno Hill (FY guide $12.50–13.50); Pan American $17.80/oz. Against Q2 realised silver of $70–79/oz, cash margins are near record.
Supply cannot respond. Around 70% of global silver is a byproduct of gold, copper, zinc and lead mines (Silver Institute); primary miners cover the remaining ~30%. Higher silver prices don't call forth new supply — most output is set by other metals.
Along with this, strong dividends and balance sheet cash positions support a re-rating from muted multiples.
Technicals
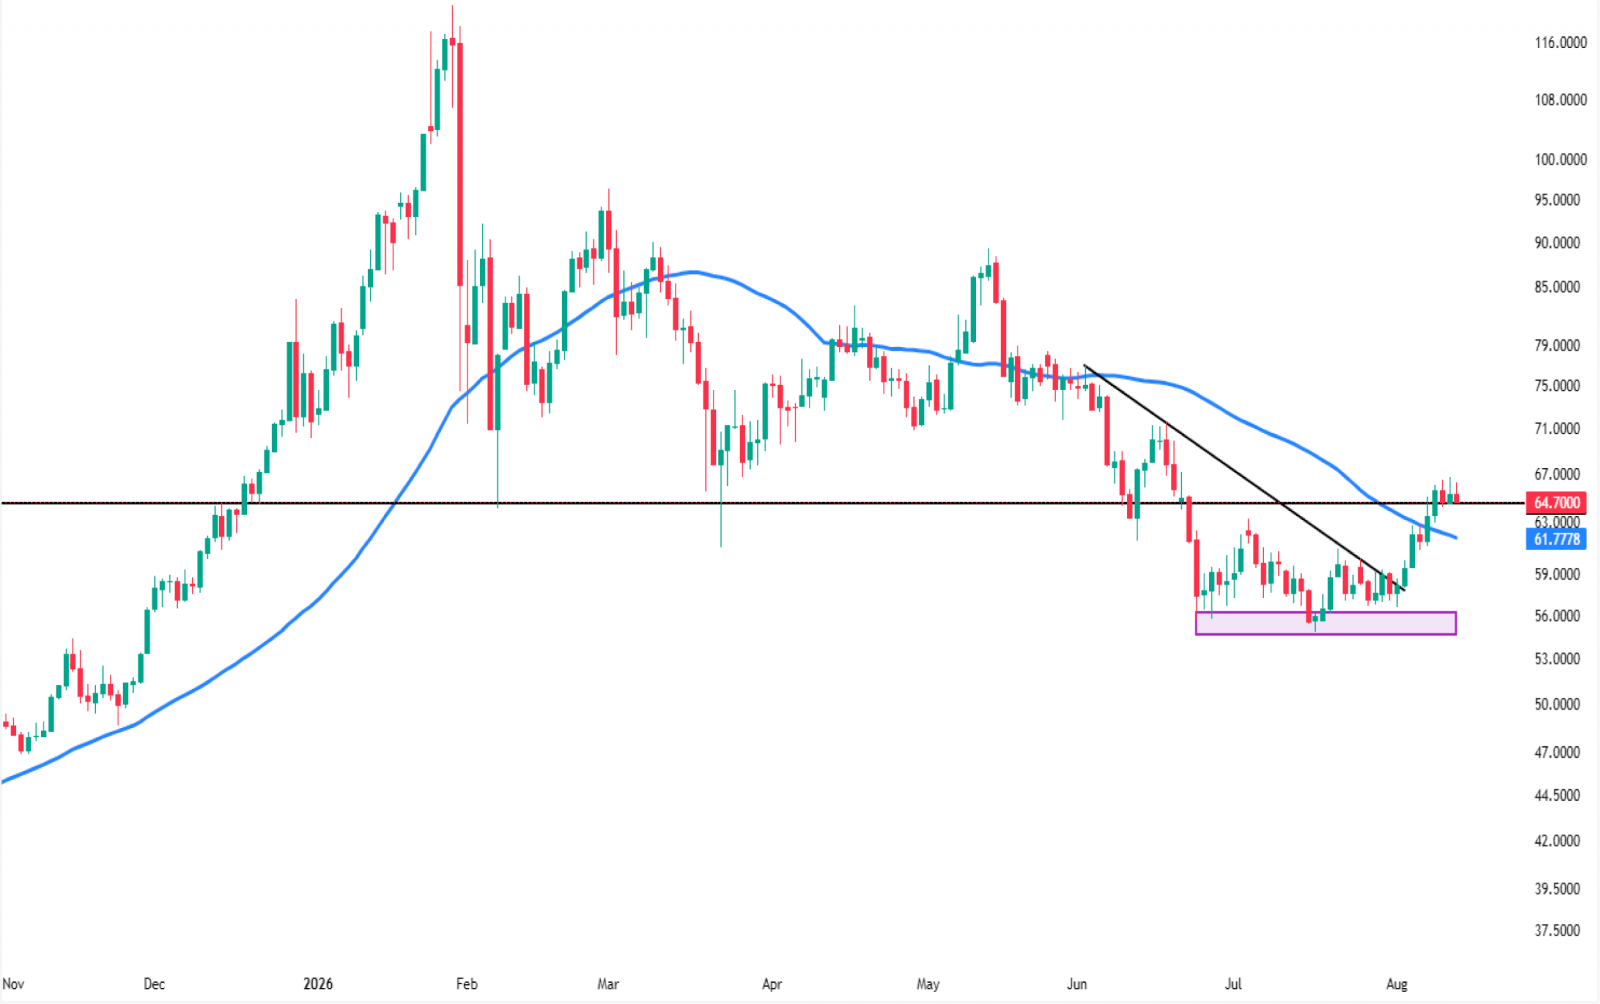
Silver had been basing around $56 since mid-June and was trading with resistance from a descending trendline formed since early June. After the NFP data release and a cooldown in yields and DXY, silver bounced from this zone, broke the descending trendline and rose above the 50-day SMA. This is a strong reversal in trend, with bulls now in control. The break above the horizontal resistance around $64 further reinforces the thesis. Prices need to hold above this level for the next leg higher.
Copper
Commodity Outlook
Copper’s outlook remains structurally bullish, supported by the global shift towards electrification and increasingly constrained supply. Rising investment in power grids, electric vehicles, renewable energy and AI-driven data centres continues to strengthen demand, with electrification-related sectors adding approximately 5 million tonnes of demand between 2019 and 2025. At the same time, expanding copper supply is becoming increasingly diffcult due to declining ore grades, rising operating costs, environmental regulations, geopolitical risks and delays in new mining projects, while disruptions in key producing regions such as Chile and Indonesia could further tighten the market. Bloomberg forecasts the copper market to move into a deficit of around 280,000 tonnes by 2027, widening to approximately 642,000 tonnes by 2030. Overall, the combination of resilient demand and structurally constrained supply creates a constructive long-term outlook for copper, with further supply disruptions potentially accelerating market tightness and supporting higher prices.
Miners as Beneficiaries
New Capacity: A Key Catalyst for Copper Miners
Beyond rising prices, miners are adding new supply — a "double engine" for earnings growth. Freeport-McMoRan Inc.'s Grasberg mine has already doubled output (34,000 to 69,000 tons/day) and targets full capacity by end-2027; its leaching initiative and Bagdad expansion could add 800M+ lbs/year long-term. Southern Copper Corp is also ramping Tía María (2027) and El Pilar (2029) mines, growing output from ~917,000 tons (2026) to over 1 million by 2029, and 1.6 million by 2033-34. Together, rising volumes alongside higher copper prices mean earnings growth from two directions at once.
Operating leverage is already showing up
Both miners are proving that higher copper prices flow straight to the bottom line: FCX's net income rose ~65% H1 2026 YoY, while SCCO's EBITDA jumped 60% and net income 72% in Q2 — even with production volumes flat or lower, showing how much profit upside comes just from price, before any volume growth kicks in.
Technicals
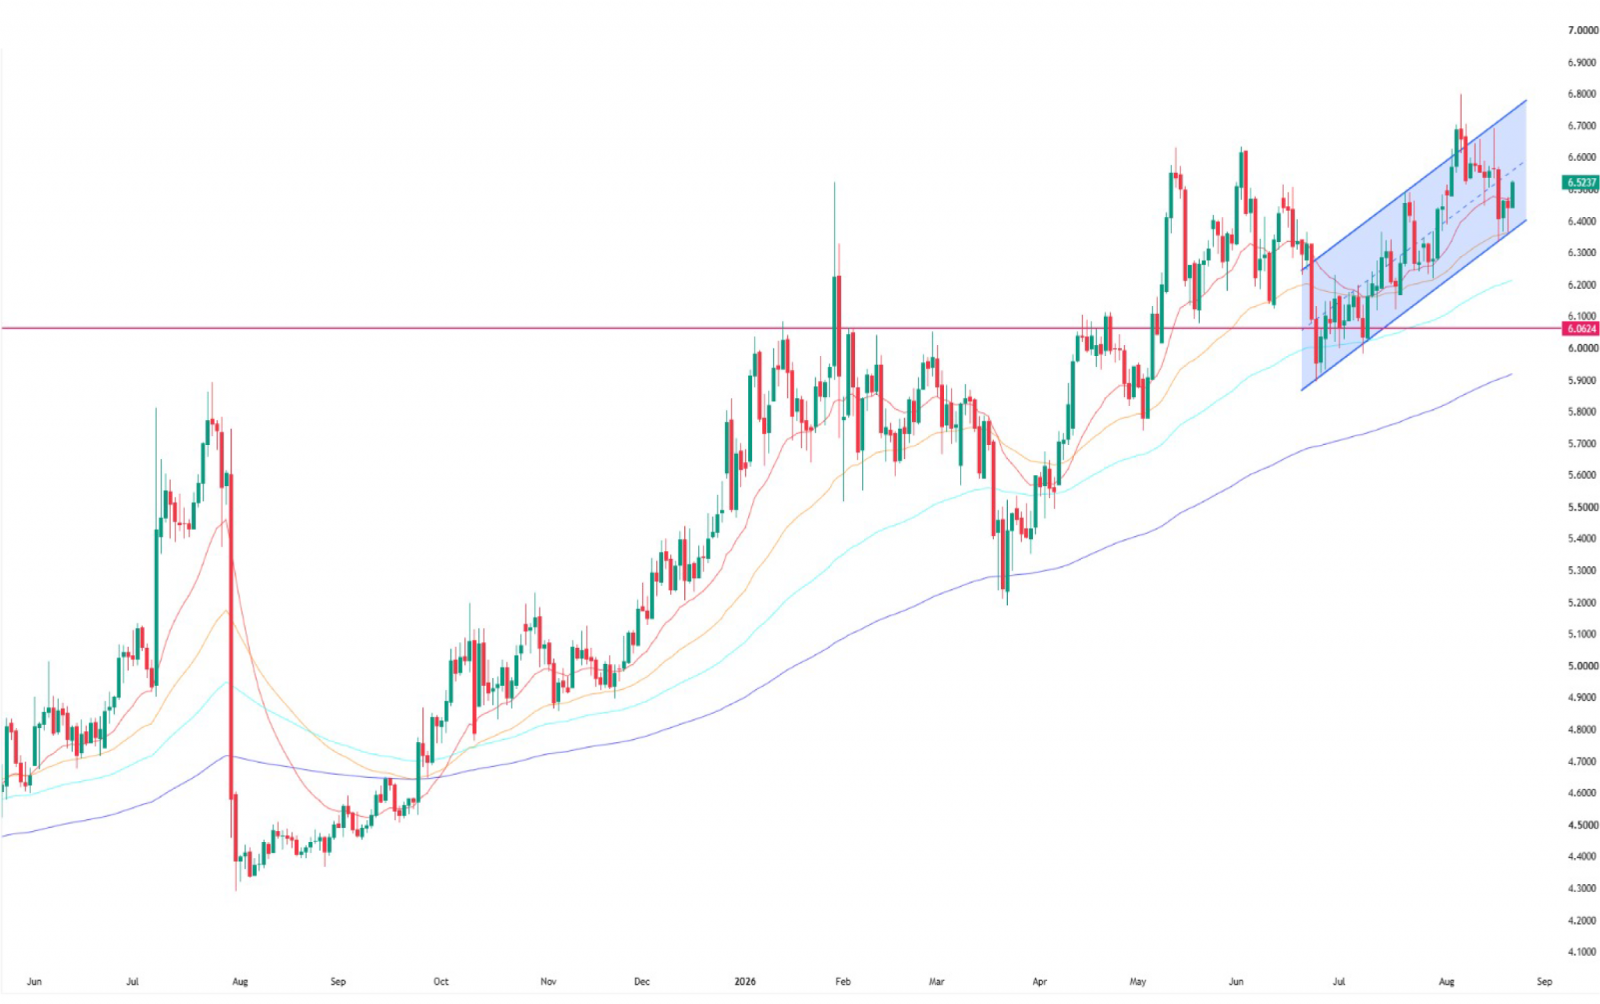
Platinum
Commodity Outlook
Platinum remains bullish over the long term, supported by persistent supply deficits, declining inventories and strong demand across the automotive, industrial and clean-energy sectors. The market is expected to remain in deficit through 2030, with cumulative shortfalls expected to further reduce already tight above-ground inventories. On the demand side, the recent West Asia conflict has highlighted the risks of global dependence on oil and imported fossil fuels, strengthening the long-term global focus on energy security and electrification. Platinum is well positioned to benefit from this transition through its important role in hydrogen fuel cells and electrolyzers, which are key technologies for producing and using clean hydrogen. Beyond clean energy, platinum remains essential across the automotive, chemical, petroleum, glass, electronics and medical industries due to its unique ability to withstand high temperatures and resist corrosion. Industrial demand is forecast to rise 9% in 2026 to 2.24 million ounces, while strong investor interest is also reflected in bar and coin demand of around 718,000 ounces. With supply remaining constrained and above-ground inventories continuing to decline, the combination of strong industrial demand, growing clean-energy applications, rising investment interest and persistent market deficits creates a highly favourable setup for further upside in platinum prices.
Technicals
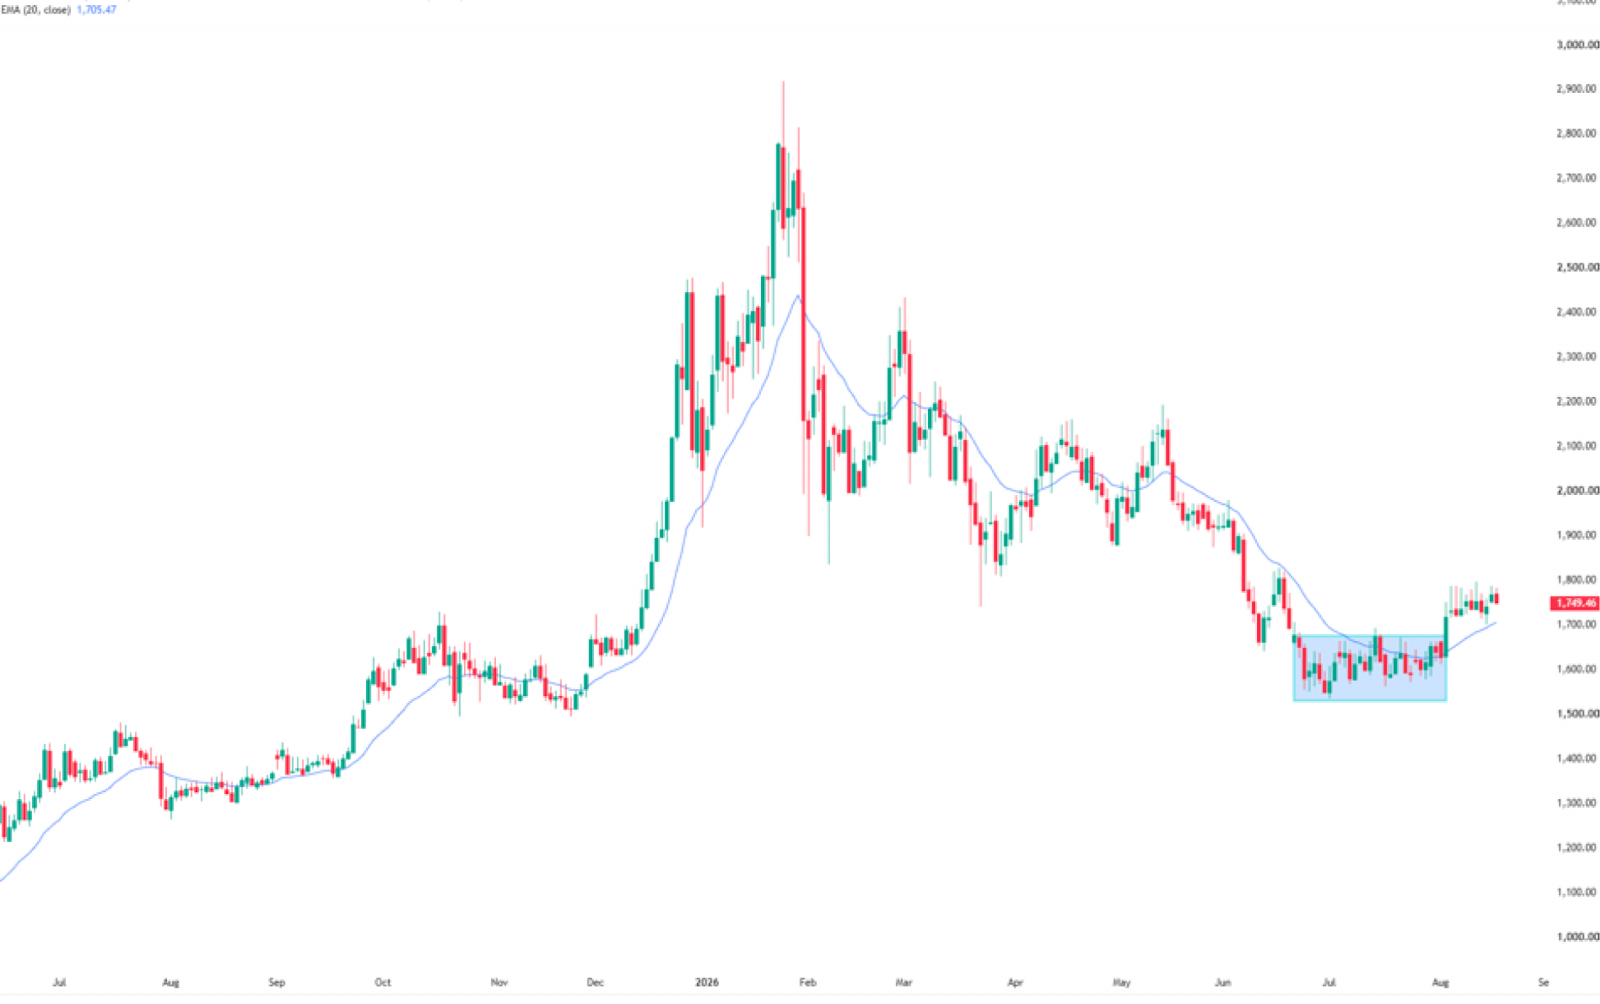
After a prolonged decline, Platinum has formed a strong base in the $1,530–$1,650 range, where prices consolidated for several weeks. The commodity has now broken out of this base, signalling a potential shift in momentum. Platinum is currently trading around $1,749, above its 20-Day EMA at $1,705, indicating that bullish momentum is gradually strengthening. Sustaining above the breakout zone will be key to confirming further upside. Holding above the breakout zone will be crucial to confirm the continuation of the bullish momentum and support further upside.
Risks and Assumptions related to Back-tested trading strategies
Disclaimer:Century Financial Consultancy LLC (CFC) is licensed and regulated by the Capital Market Authority (CMA) of the UAE under license numbers 20200000028 and 301044 to carry out the activities of Financial Products dealer, Trading Broker in international markets, Trading Broker of OTC derivatives and currencies in the spot market, Introduction, Financial Consultations, and Promotion. CFC is incorporated under UAE law, registered with the Dubai Economic Department (No. 768189), with its office at 601, Level 6, Building No. 4, Emaar Square, Downtown Dubai, UAE, PO Box 65777.
Terms and Conditions of Access
By accessing and continuing to use the Publication (which includes this document, flyer, charts, diagrams, illustrations, images, calculations, scenario analysis, and related data or content), you confirm that you have read, understood, and agreed to the terms of this Disclaimer.
CFC reserves the right to amend or update the Publication and this Disclaimer at any time without prior notice. Continued use following any such update constitutes your acceptance of the revised terms. If you do not agree with these terms, please discontinue use of the Publication.
Purpose and Intended Use
This Publication is classified as marketing material and should not be regarded as independent investment research. It is provided for informational, educational, and illustrative purposes only and does not constitute investment advice, a recommendation, an offer, or a solicitation to buy or sell any financial instruments or services. All views expressed are general market commentary and may not reflect the opinions of CFC as a whole.
Risk Disclosures and Limitations
The information presented does not cover all the risks associated with the products or scenarios discussed. Please refer to the full Risk Disclosure Statement available on our website.
This Publication reflects information available at the time of preparation and does not account for subsequent developments. Any forward-looking statements involve assumptions and uncertainties; actual outcomes may differ materially. CFC does not guarantee the accuracy, completeness, or reliability of the information and disclaims liability for any action taken based on it.
No Offer or Contractual Commitment
No part of this Publication constitutes an offer, agreement, or commitment to enter into any transaction. Distribution of this Publication does not oblige CFC to engage in any trade or provide any services. Product names or terms may differ across platforms or providers. This material should not be interpreted as legal, regulatory, tax, accounting, or credit advice. Recipients should seek independent professional advice and assess their own financial situation, objectives, and risk profile before making investment decisions.
Data Sources and Interpretation
This Publication may rely on publicly available data, third-party information, or model-based assumptions. CFC makes no representation or warranty as to their accuracy or completeness. Data limitations, errors, or outdated inputs may impact the reliability of projections or scenarios. Names of financial products may differ from those used on trading platforms.
Use, Reproduction, and Analyst Disclosure
This Publication is intended solely for the recipient’s informational use. It may not be copied, transmitted, or distributed in any form, wholly or partially, without prior written permission from CFC.
Analyst Declaration: The Analyst(s) certifies that all opinions expressed in this Publication represent their own independent views and that reasonable care was taken to ensure objectivity. They do not hold securities in the companies mentioned, and their compensation is not linked to the views expressed. CFC’s research and marketing divisions operate independently.
Trading Risk Warning:
Trading in financial products involves significant risk. Leveraged OTC derivatives, such as Contracts for Difference (CFDs) and spot forex contracts, carry a high risk of loss that can potentially exceed initial deposits and may not be suitable for all investors. These instruments do not confer ownership of underlying assets. Investors must carefully evaluate their investment objectives and risk tolerance, and consult independent advisors where appropriate.
__706859886.jpg)





Regulated by CMA
Century Financial Consultancy LLC








Reach us:
-
Dubai
6th Floor, Emaar Square Building 4,
Downtown, Dubai, P.O. Box 65777,
Dubai, United Arab Emirates -
Abu Dhabi
27th Floor, Office 2701,
Shining Towers, Abu Dhabi, UAE -
Sharjah
29th Floor, Office 2905,
The Business Tower, Sharjah, UAE - +971 (4) 356 2800
- info@century.ae

Disclaimer: Trading in financial products carries substantial risk. Leveraged over-the-counter (OTC) derivatives, such as Contracts for Difference (CFDs) and spot forex, may result in losses exceeding initial deposits and may not be suitable for all investors. These complex instruments do not confer ownership of the underlying assets. Investors should carefully consider their investment objectives and risk appetite, and seek independent professional advice if necessary.
Century Financial Consultancy LLC (CFC) is licensed and regulated by the Capital Market Authority (CMA) of the UAE under license numbers 20200000028 and 301044 to carry out the activities of Financial Products dealer, Trading Broker in international markets, Trading Broker of OTC derivatives and currencies in the spot market, Introduction, Financial Consultations, and Promotion. CFC is incorporated under UAE law, registered with the Dubai Economic Department (No. 768189), with its office at 601, Level 6, Building No. 4, Emaar Square, Downtown Dubai, UAE, PO Box 65777.
The content on this website is provided solely for informational and educational purposes and does not constitute an offer, recommendation, or solicitation to buy or sell any securities or financial products.
Products and services offered by CFC are not intended for use in any jurisdiction where such use or distribution would breach local laws or regulatory requirements.
⚠️ Alert: Fraudulent Activity Notice
Century Financial Consultancy LLC (“Century”) has become aware of fraudulent individuals and entities impersonating our firm through unofficial websites, social media channels, and messaging applications such as Telegram, WhatsApp, and Discord.
Please be advised:
- Century does not manage investments on behalf of clients.
- Century does not solicit funds or guarantee investment returns.
- Century does not accept or make payments in cash, cryptocurrency, or digital assets.
- We do not conduct business via social media or messaging platforms.
Our only official website is www.century.ae, and all communication is conducted exclusively through verified channels.
We strongly urge the public to remain vigilant, verify the authenticity of any communication claiming to be from Century, and report any suspicious activity. Century disclaims any responsibility for losses arising from dealings with unauthorised or fraudulent parties.
