 Loading ...

Monday, August 31, 2026
Neocloud Buildout: Scaling Ai's Compute Frontier
By Century Financial in 'Investment Insights'

.jpg)
SECTOR OVERVIEW
What Are Neoclouds?
Neoclouds are a new generation of cloud computing providers built specifically for AI-focused companies, offering access to large-scale GPU infrastructure for training and running AI models. Unlike traditional hyperscalers that support a broad ecosystem of workloads, neoclouds specialise exclusively in GPU compute, giving AI businesses the dedicated infrastructure they need at scale.
As AI continues to evolve, enterprises need purpose-built cloud partners that understand the demands of large-scale model training, inference, and data-intensive workloads. Neoclouds deploy disaggregated compute, GPU-optimised networking, and carbon-aware schedulers that cut energy use 30–50% relative to conventional clouds.
MARKET ANALYSIS
Neocloud Market: From $35 Billion to $237 Billion by 2031
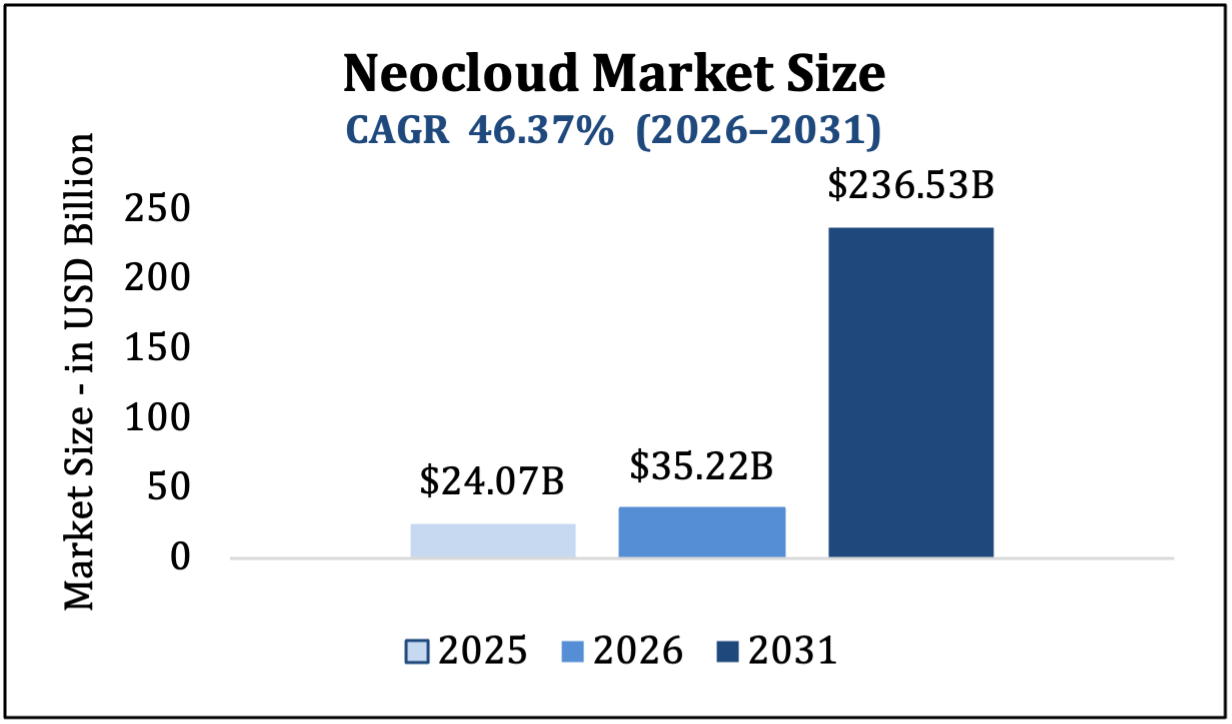
The neocloud market in 2026 is estimated at USD 35.22 billion, growing from USD 24.07 billion in 2025, with 2031 projections reaching USD 236.53 billion at a 46.37% CAGR over 2026–2031. Regional demand remains strongest in North America, while Asia Pacific also delivers a steep growth curve as 5G and industrial digitalisation converge with protective data policies.
MARKET OVERVIEW
$35.22B
Market Size 2026 (USD)
46.37%
CAGR 2026–2031
$236.53B
Projected Market Size by 2031
| Study Period | 2020 – 2031 |
| Market Size (2026) | USD 35.22 Billion |
| Market Size (2031) | USD 236.53 Billion |
| Growth Rate (2026-2031) | 46.37% CAGR |
| Fastest Growing Market | Asia Pacific |
| Largest Market | North America |
| Market Concentration | Medium |
Source: Modor Intelligence
STRUCTURAL DEMAND DRIVER
The Jevons Paradox Is Driving the Buildout
demand rises Outpaces per-unit efficiency gains
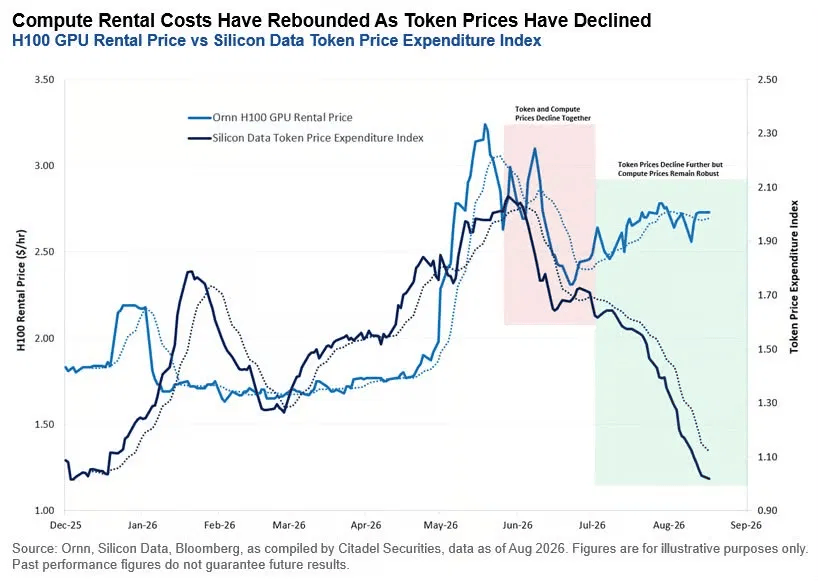
Every AI interaction is priced in tokens, which is the unit of inference work a model performs. The cost per token has fallen steadily as GPUs, model architectures, and optimisation techniques improve. Standard economic logic says falling unit cost should reduce total resource use. AI compute is behaving the opposite way.
As the cost of running models falls, organisations embed them into more processes and expand usage enough that infrastructure demand rises rather than shrinks — a live case of Jevons Paradox.
For instance, when OpenAI cut prices on GPT-5.6 Luna and Terra models by 80% and 20% respectively, Luna's effective price fell ~10× while consumption rose ~14×, with estimated revenue still climbing 34%. Cheaper tokens did not shrink the compute bill, they enlarged it. This is the demand engine behind sustained neocloud buildout.
Stock & ETF Snapshot
| Name | Ticker | 52 Week Low ($) |
*Last Price ($) |
52 Week High ($) |
Market Capitalization ($ Billion) |
Analyst Target Price ($) |
Potential Price Appreciation (%) |
Recommendation Consensus (Out of 5) |
|---|---|---|---|---|---|---|---|---|
| Nebius Group NV | NBIS | 63.26 | 221.97 | 299.86 | 60.34 | 295.41 | 33% | 4.32 |
| CoreWeave Inc | CRWV | 60.55 | 88.04 | 153.20 | 49.20 | 145.00 | 65% | 4.21 |
| IREN Ltd | IREN | 22.04 | 42.21 | 76.87 | 15.66 | 82.80 | 96% | 4.47 |
| Hut 8 Corp | HUT | 23.03 | 85.50 | 140.80 | 10.54 | 164.33 | 92% | 4.95 |
| Terawulf Inc | WULF | 8.60 | 16.32 | 29.84 | 8.14 | 36.61 | 124% | 4.95 |
| Name | Ticker | Beta | 1-yr Fwd Revenue Growth (%) |
|---|---|---|---|
| Nebius Group NV | NBIS | 2.75 | 513.30 |
| CoreWeave Inc | CRWV | 1.70 | 152.49 |
| IREN Ltd | IREN | 2.83 | 40.60 |
| Hut 8 Corp | HUT | 2.62 | 23.15 |
| Terawulf Inc | WULF | 2.83 | 45.41 |
| Name | Ticker | Primary Exchange Name |
*Last Price |
52 Week Low |
52 Week High |
NAV | % Premium/ Discount |
Total Assets (In $ billions) |
Expense Ratio |
|---|---|---|---|---|---|---|---|---|---|
| ROUNDHILL NEOCLOUD ETF |
NCLD | NASDAQ GM | $23.72 | $21.80 | $28.10 | $23.70 | 0.10 | $57.82 | 0.65% |
*CMP as of closing prices on 25 August 2026.
Neocloud Stocks to Watch
CoreWeave
CRWV
A US pure-play neocloud, CoreWeave reported Q2 2026 revenue of $2.575 billion, more than double the prior year, with $103.7 billion in unsatisfied remaining performance obligations as of June 30, 2026, excluding over $25 billion in net new commitments added in early Q3. Adjusted EBITDA margin reached 59%. The stock is a high-leverage, high-visibility way to play firm GPU rental pricing.
Nebius Group
NBIS
A European-rooted, vertically integrated AI cloud operator, Nebius posted group revenue of $582.3 million, up 454% year on year, with its core AI cloud segment growing 514%. It raised on-demand GPU pricing by an average of 29% effective June 1, 2026, and its H100 on-demand rate moved to $3.85 per hour from $2.95, direct evidence of rate power in a period of falling token prices. It signed a Meta partnership worth up to $27 billion and structures roughly 70% of signed deals with customer prepayments, reducing reliance on debt-funded build-out.
IREN Ltd
IREN
IREN began as a bitcoin miner and has repositioned its existing power and land infrastructure toward AI and HPC hosting. Its March-quarter revenue was $144.8 million, with AI Cloud Services revenue nearly doubling sequentially to $33.6 million, alongside a $9.7 billion, five-year GPU services contract with Microsoft. IREN has raised its year-end 2026 annualised AI cloud run-rate target from $3.7 billion to more than $4 billion after signing $2.8 billion of new multi-year contracts, with roughly 85% of that target already contracted.
Hut 8 Corp
HUT
Hut 8 is also repositioning from bitcoin mining toward energy infrastructure for AI, pairing its existing power assets with long-duration, triple-net leases to investment-grade tenants. Second-quarter 2026 revenue was $74.9 million, up 81% year on year, with compute segment gross margin of roughly 64-66%. The company now has approximately 949 MW of contracted AI capacity across its River Bend and Beacon Point sites, representing roughly $26.6 billion in expected base-term contract value, alongside a broader 8,660 MW development pipeline.
TeraWulf Inc
WULF
TeraWulf is a former bitcoin miner that has repositioned toward HPC leasing, backed by Google and Fluidstack as anchor tenants. Second-quarter 2026 revenue was $44.8 million, with HPC lease revenue of $31.9 million, about 71% of the total, up 52% sequentially. Delivery of its CB-3 data hall lifted operating capacity to 102 MW and triggered $600 million of Google credit support for Fluidstack's lease obligations. In July, TeraWulf signed a 20-year, roughly 401-megawatt lease with Anthropic, representing approximately $19 billion in contracted revenue.
Risks and Assumptions related to Back-tested trading strategies
Disclaimer:Century Financial Consultancy LLC (CFC) is licensed and regulated by the Capital Market Authority (CMA) of the UAE under license numbers 20200000028 and 301044 to carry out the activities of Financial Products dealer, Trading Broker in international markets, Trading Broker of OTC derivatives and currencies in the spot market, Introduction, Financial Consultations, and Promotion. CFC is incorporated under UAE law, registered with the Dubai Economic Department (No. 768189), with its office at 601, Level 6, Building No. 4, Emaar Square, Downtown Dubai, UAE, PO Box 65777.
Terms and Conditions of Access
By accessing and continuing to use the Publication (which includes this document, flyer, charts, diagrams, illustrations, images, calculations, scenario analysis, and related data or content), you confirm that you have read, understood, and agreed to the terms of this Disclaimer.
CFC reserves the right to amend or update the Publication and this Disclaimer at any time without prior notice. Continued use following any such update constitutes your acceptance of the revised terms. If you do not agree with these terms, please discontinue use of the Publication.
Purpose and Intended Use
This Publication is classified as marketing material and should not be regarded as independent investment research. It is provided for informational, educational, and illustrative purposes only and does not constitute investment advice, a recommendation, an offer, or a solicitation to buy or sell any financial instruments or services. All views expressed are general market commentary and may not reflect the opinions of CFC as a whole.
Risk Disclosures and Limitations
The information presented does not cover all the risks associated with the products or scenarios discussed. Please refer to the full Risk Disclosure Statement available on our website.
This Publication reflects information available at the time of preparation and does not account for subsequent developments. Any forward-looking statements involve assumptions and uncertainties; actual outcomes may differ materially. CFC does not guarantee the accuracy, completeness, or reliability of the information and disclaims liability for any action taken based on it.
No Offer or Contractual Commitment
No part of this Publication constitutes an offer, agreement, or commitment to enter into any transaction. Distribution of this Publication does not oblige CFC to engage in any trade or provide any services. Product names or terms may differ across platforms or providers. This material should not be interpreted as legal, regulatory, tax, accounting, or credit advice. Recipients should seek independent professional advice and assess their own financial situation, objectives, and risk profile before making investment decisions.
Data Sources and Interpretation
This Publication may rely on publicly available data, third-party information, or model-based assumptions. CFC makes no representation or warranty as to their accuracy or completeness. Data limitations, errors, or outdated inputs may impact the reliability of projections or scenarios. Names of financial products may differ from those used on trading platforms.
Use, Reproduction, and Analyst Disclosure
This Publication is intended solely for the recipient’s informational use. It may not be copied, transmitted, or distributed in any form, wholly or partially, without prior written permission from CFC.
Analyst Declaration: The Analyst(s) certifies that all opinions expressed in this Publication represent their own independent views and that reasonable care was taken to ensure objectivity. They do not hold securities in the companies mentioned, and their compensation is not linked to the views expressed. CFC’s research and marketing divisions operate independently.
Trading Risk Warning:
Trading in financial products involves significant risk. Leveraged OTC derivatives, such as Contracts for Difference (CFDs) and spot forex contracts, carry a high risk of loss that can potentially exceed initial deposits and may not be suitable for all investors. These instruments do not confer ownership of underlying assets. Investors must carefully evaluate their investment objectives and risk tolerance, and consult independent advisors where appropriate.
__706859886.jpg)




Regulated by CMA
Century Financial Consultancy LLC








Reach us:
-
Dubai
6th Floor, Emaar Square Building 4,
Downtown, Dubai, P.O. Box 65777,
Dubai, United Arab Emirates -
Abu Dhabi
27th Floor, Office 2701,
Shining Towers, Abu Dhabi, UAE -
Sharjah
29th Floor, Office 2905,
The Business Tower, Sharjah, UAE - +971 (4) 356 2800
- info@century.ae

Disclaimer: Trading in financial products carries substantial risk. Leveraged over-the-counter (OTC) derivatives, such as Contracts for Difference (CFDs) and spot forex, may result in losses exceeding initial deposits and may not be suitable for all investors. These complex instruments do not confer ownership of the underlying assets. Investors should carefully consider their investment objectives and risk appetite, and seek independent professional advice if necessary.
Century Financial Consultancy LLC (CFC) is licensed and regulated by the Capital Market Authority (CMA) of the UAE under license numbers 20200000028 and 301044 to carry out the activities of Financial Products dealer, Trading Broker in international markets, Trading Broker of OTC derivatives and currencies in the spot market, Introduction, Financial Consultations, and Promotion. CFC is incorporated under UAE law, registered with the Dubai Economic Department (No. 768189), with its office at 601, Level 6, Building No. 4, Emaar Square, Downtown Dubai, UAE, PO Box 65777.
The content on this website is provided solely for informational and educational purposes and does not constitute an offer, recommendation, or solicitation to buy or sell any securities or financial products.
Products and services offered by CFC are not intended for use in any jurisdiction where such use or distribution would breach local laws or regulatory requirements.
⚠️ Alert: Fraudulent Activity Notice
Century Financial Consultancy LLC (“Century”) has become aware of fraudulent individuals and entities impersonating our firm through unofficial websites, social media channels, and messaging applications such as Telegram, WhatsApp, and Discord.
Please be advised:
- Century does not manage investments on behalf of clients.
- Century does not solicit funds or guarantee investment returns.
- Century does not accept or make payments in cash, cryptocurrency, or digital assets.
- We do not conduct business via social media or messaging platforms.
Our only official website is www.century.ae, and all communication is conducted exclusively through verified channels.
We strongly urge the public to remain vigilant, verify the authenticity of any communication claiming to be from Century, and report any suspicious activity. Century disclaims any responsibility for losses arising from dealings with unauthorised or fraudulent parties.
