 Loading ...

.jpg)
Investment Thesis
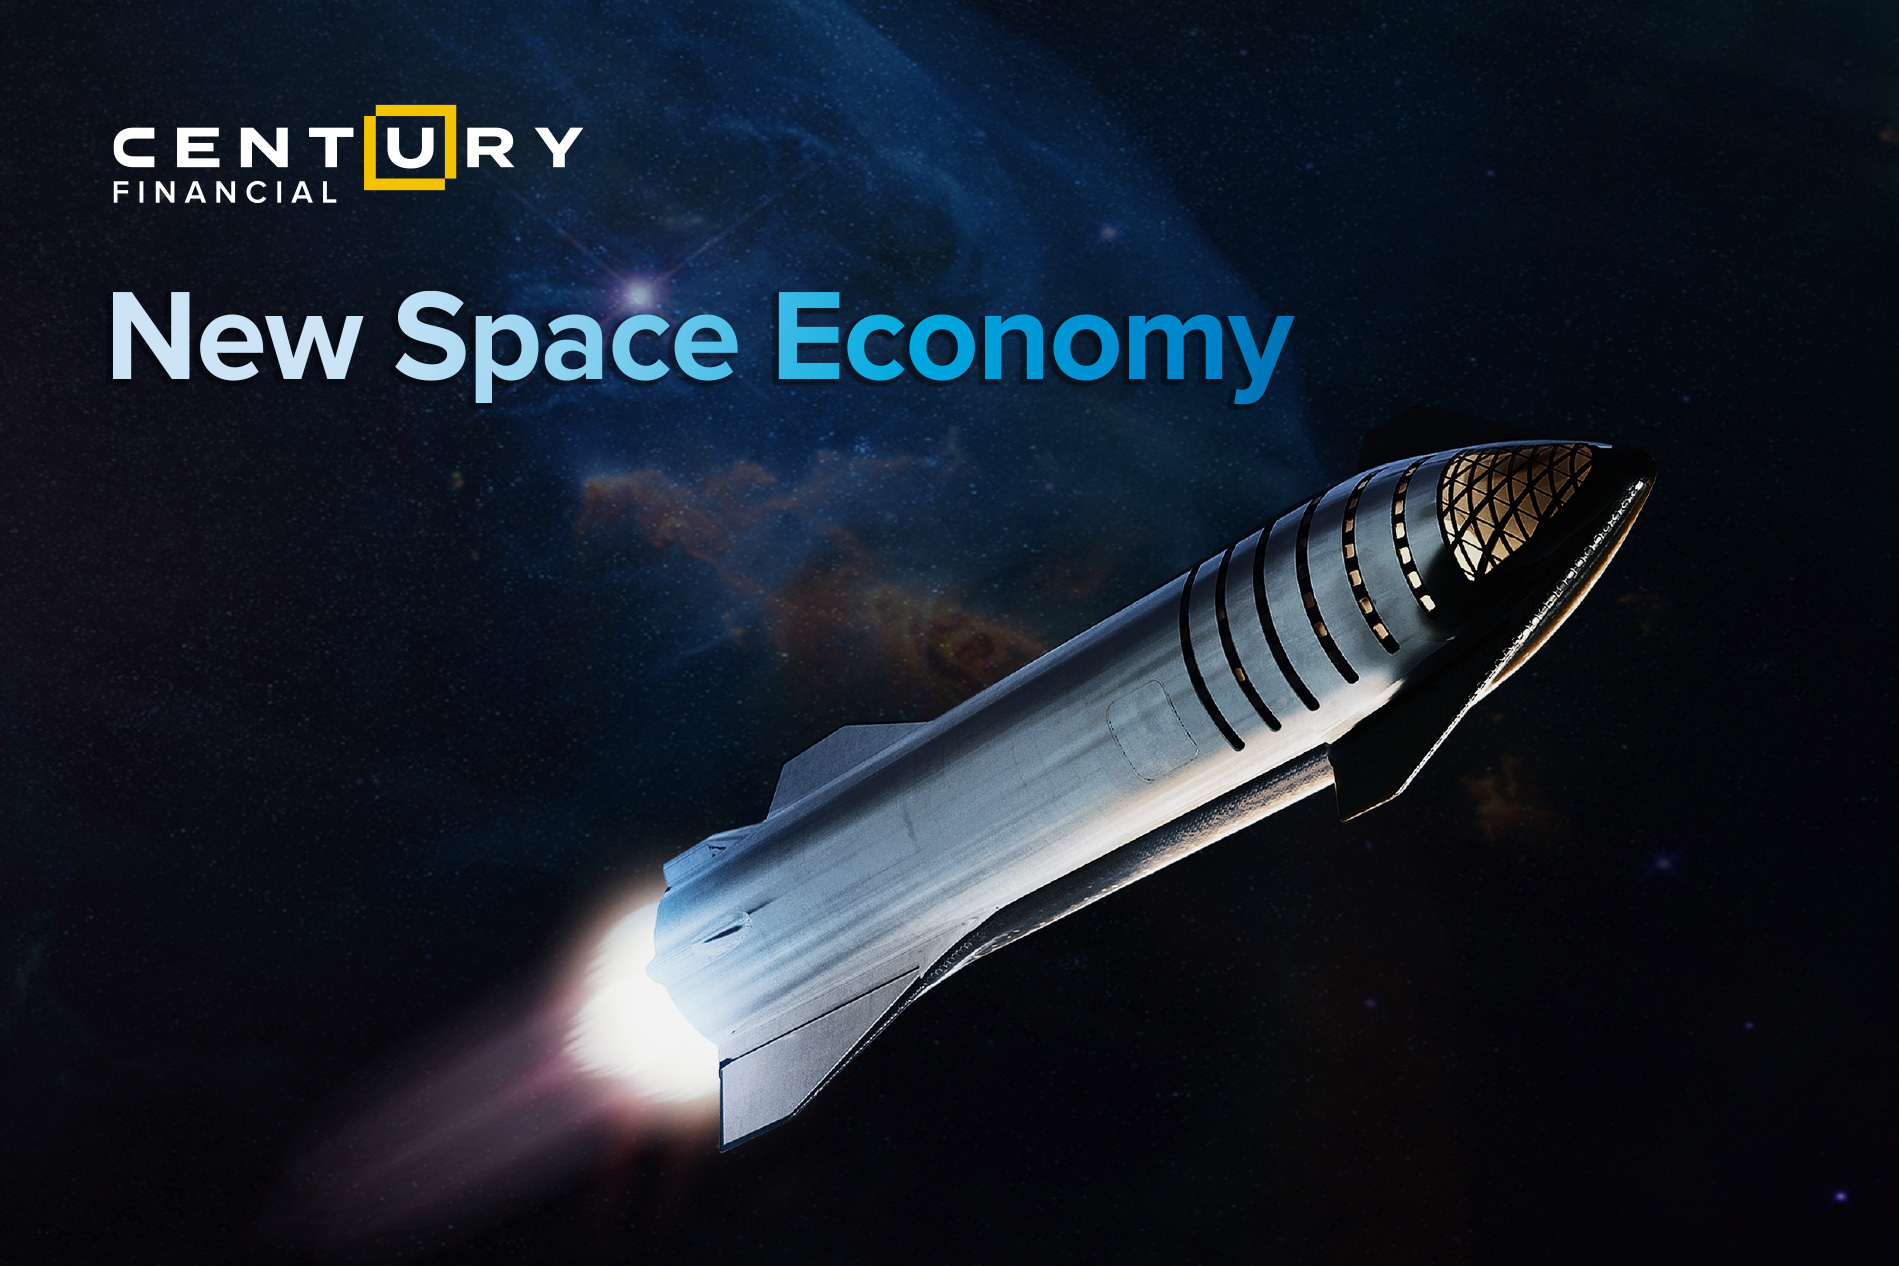
The commercial space sector has transitioned from hype to tangible revenue, and a now-visible SpaceX IPO timeline is emerging as the single most powerful near-term catalyst for a re-rating across the listed ecosystem. The company reportedly filed confidentially with the U.S. Securities and Exchange Commission on April 1, 2026, targeting a $1.75T–$2T valuation, with a roadshow expected around June 8 and a potental listing by June 12.
Public market peers stand to benefit as derivative plays on both the IPO event and the broader structural build-out of the orbital economy. Companies such as Rocket Lab, Planet Labs, and AST SpaceMobile are participating in various segments of the evolving commercial space industry, offering investors exposure to areas such as launch services, Earth observation, and satellite-based communications.

Apr 1, 2026
2026
SpaceX has assembled a ~21-bank underwriting syndicate led by Morgan Stanley, Goldman Sachs, JPMorgan, BofA, and Citi. The deal is expected to see unprecedented demand, with reports indicating a potential retail allocation of ~30%. This is significantly above the typical 5–10%, although final allocations remain subject to change.
SpaceX generated ~$18.5B in 2025 revenue. Feb 2026 merger with xAI pushed combined private market value to ~$1.25T. At $2T, implied valuation is ~108x 2025 revenue — warranted by Starlink's 9M subscribers, 88.5% global launch share, and Starship as the only credible heavy-lift platform.
The Tema Space Exploration & Innovation ETF (NASA) holds indirect exposure to SpaceX through a special purpose vehicle (SPV), providing rare pre-IPO access within a public ETF structure. While position sizing may vary over time, such structures typically convert into publicly traded shares post-listing, subject to lock-up periods and portfolio rebalancing.
LISTED EQUITY PROFILES

+63.5% YoY
First positive
$248.4M → $503.7M
Margins - 37% → 40%
Rocket Lab is the world's most frequently launched small rocket company and the only vertically integrated Western alternative to SpaceX, providing launch services, spacecraft, payloads, and satellite components for commercial, government, and national security markets.
Revenue trajectory: $62M (2021) → $602M (2025) → $679M LTM. Q1 2026 at $200M alone makes full-year trajectory look strong — run-rate annualises above $800M before any seasonal step-up.
Margin expansion structural: Gross Margins - 9% (2022) → 34.4% (2025) → 36.6% LTM. EBITDA crosses positive in 2027E at $133.5M
Defence deepening: Rocket Lab’s backlog is shifting toward defense and space systems (70%), with growing hypersonics demand, supported by Mynaric and Motiv acquisitions. Backlog mix is shifting to high margin space and defence systems revenue.
Neutron launch delayed: Neutron’s debut has slipped to Q4 2026 following a Stage 1 tank test failure. Rocket Lab’s ~$2.2B backlog and $225–240M Q2 guidance are driven primarily by Electron and Space Systems, with minimal near-term reliance on Neutron, though some long-dated contracts are included.

YoY 1,505%+
AST SpaceMobile is developing the world's first space-based cellular broadband network, enabling standard smartphones to connect directly to satellites without specialized hardware. BlueBird 6 confirmed 98.9 Mbps peak data speed. FCC commercial DTC authorisation granted April 2026.
Technology proven; timeline is the variable. FCC filings support a constellation of up to ~240–250 satellites using 700/800 MHz partner spectrum. Launch cadence remains the key constraint. Delays in satellite deployment would push revenue ramp timing.
Partner network is deep and contracted: Verizon, stc Group ($175M prepayment), Vodafone, AT&T, Rakuten — 50+ MNOs covering ~3 billion subscribers. Revenue gating is satellite count, not demand.
Balance sheet is not the risk. $3.5B cash provides 18–24 months of runway at current burn regardless of near-term slippage. Constellation cadence is the watchpoint.

(38%+)
First profitable yr
recurring 98%
Planet Labs operates the world's largest Earth-imaging constellation (200+ satellites, near-daily global coverage). FY2026 was a transformational year: the company delivered its first full-year Adj. EBITDA profit and positive free cash flow, driven by accelerating defence demand, AI integration, and strategic partnerships. Note: Planet's fiscal year ends January 31.
Profitability inflection is structural. First full-year EBITDA profit ($15.5M) and positive FCF ($52.9M) reflect multi-year operating leverage — not a one-quarter anomaly. RPO surged 106% to $852M. ACV is 98% recurring.
Defence & Intelligence grew >50% YoY in FY2026 — the fastest segment. $640M cash at year-end with no debt overhang. Google R&D partnership for space-based data centres.
FY2027 guide of $415–440M implies 38% growth from an already-profitable base. Non-GAAP GM of 59% is differentiated vs all hardware-heavy peers. At ~$2.5–3B market cap, stock implies ~6–7x forward EV/Revenue with expanding EBITDA.

post-Lanteris
First positive
First positive
Intuitive Machines is the leading commercial executor of America's return to the Moon, with NASA's Artemis programme as its anchor client. The $800M Lanteris Space Systems acquisition (closed Q1 2026) accelerated 2026 revenue guidance to $900M–$1B, implying more than 350% annual growth and positive Adj. EBITDA.
Lanteris transforms the financial profile: Lanteris is a significant revenue and EBITDA contributor to Intuitive Machines, with disclosed profitability at the EBITDA level prior to acquisition, though exact LTM revenue and margin figures are not fully verified in public filings. EBITDA turns positive in 2026E at $28.5M. Net Income turns positive in 2027E at $7.5M — first time in company history.
Operational credibility established: One lunar landing completed — IM-1 (2024), marking the first U.S. lunar landing since Apollo, though with a non-nominal touchdown. IM-2 remains a planned mission with no confirmed completed landing yet. Fifth NASA CLPS task order ($180M, Nova-D cargo lander) secured. Selected as a participant in the MDA SHIELD IDIQ.
NASA LTV ($4.6B ceiling) is the binary near-term catalyst. NASA LTV (~$4.6B ceiling) is a major near-term catalyst - A contract win would materially de-risk the long-term revenue profile. Lanteris integration should be closely monitored in initial combined financials, as reported revenue contributions are based on pre-acquisition figures and not yet fully validated within consolidated results.
.png)
(Margin 3.9%)
Deliveries
Redwire is a leading manufacturer of spacecraft components and in-space systems — deployable solar arrays, booms, antennas, and in-space manufacturing platforms — with structural exposure to every major orbital programme: SDA constellations, Starlink, NASA science missions, and commercial Earth observation.
Edge Autonomy acquisition (June 2025) deepened vertical integration and is the primary driver of gross margin: expansion: 5.2% (FY2025) → 9.2% LTM → 26% (2026E) → 27% (2027E). EBITDA near-breakeven in 2026E, definitively positive in 2027E at +$22.1M.
Book-to-bill 1.92x in Q1 2026: Order intake running ahead of revenue recognition. Bloomberg 2026E revenue growth of 40.6% is anchored by contract awards already on the books.
Cash discipline is the key monitoring variable. LTM FCF is -$155M and is expected to get better in 2026 & 27. The 2026E EBITDA breakeven is the inflection point and the positive 2027 estimated EBITDA should be closely monitored.
SPACE ETF ACCESS — NASA & UFO
NASA is currently the only dedicated space ETF reported to have direct pre-IPO SpaceX exposure, achieved through a special purpose vehicle (SPV). The actively managed portfolio holds roughly 30–40 space-related names including RKLB and ASTS. Exact SpaceX share-equivalent exposure fluctuates over time and is held indirectly through the SPV structure.
The Fund seeks investment results that correspond generally to the performance of an equity index called the S-Network Space Index ("SPACE"). It has an AUM of $864.84 million and top weights to companies like Rocket Lab, Planet Labs, and Viasat.
Risks and Assumptions related to Back-tested trading strategies
Disclaimer: Century Financial Consultancy LLC (CFC) is licensed and regulated by the Capital Market Authority (CMA) of the UAE under license numbers 20200000028 and 301044 to carry out the activities of Financial Products dealer, Trading Broker in international markets, Trading Broker of OTC derivatives and currencies in the spot market, Introduction, Financial Consultations, and Promotion. CFC is incorporated under UAE law, registered with the Dubai Economic Department (No. 768189), with its office at 601, Level 6, Building No. 4, Emaar Square, Downtown Dubai, UAE, PO Box 65777.
Terms and Conditions of Access
By accessing and continuing to use the Publication (which includes this document, flyer, charts, diagrams, illustrations, images, calculations, scenario analysis, and related data or content), you confirm that you have read, understood, and agreed to the terms of this Disclaimer.
CFC reserves the right to amend or update the Publication and this Disclaimer at any time without prior notice. Continued use following any such update constitutes your acceptance of the revised terms. If you do not agree with these terms, please discontinue use of the Publication.
Purpose and Intended Use
This Publication is classified as marketing material and should not be regarded as independent investment research. It is provided for informational, educational, and illustrative purposes only and does not constitute investment advice, a recommendation, an offer, or a solicitation to buy or sell any financial instruments or services. All views expressed are general market commentary and may not reflect the opinions of CFC as a whole.
Risk Disclosures and Limitations
The information presented does not cover all the risks associated with the products or scenarios discussed. Please refer to the full Risk Disclosure Statement available on our website.
This Publication reflects information available at the time of preparation and does not account for subsequent developments. Any forward-looking statements involve assumptions and uncertainties; actual outcomes may differ materially. CFC does not guarantee the accuracy, completeness, or reliability of the information and disclaims liability for any action taken based on it.
No Offer or Contractual Commitment
No part of this Publication constitutes an offer, agreement, or commitment to enter into any transaction. Distribution of this Publication does not oblige CFC to engage in any trade or provide any services. Product names or terms may differ across platforms or providers. This material should not be interpreted as legal, regulatory, tax, accounting, or credit advice. Recipients should seek independent professional advice and assess their own financial situation, objectives, and risk profile before making investment decisions.
Data Sources and Interpretation
This Publication may rely on publicly available data, third-party information, or model-based assumptions. CFC makes no representation or warranty as to their accuracy or completeness. Data limitations, errors, or outdated inputs may impact the reliability of projections or scenarios. Names of financial products may differ from those used on trading platforms.
Use, Reproduction, and Analyst Disclosure
This Publication is intended solely for the recipient’s informational use. It may not be copied, transmitted, or distributed in any form, wholly or partially, without prior written permission from CFC.
Analyst Declaration: The Analyst(s) certifies that all opinions expressed in this Publication represent their own independent views and that reasonable care was taken to ensure objectivity. They do not hold securities in the companies mentioned, and their compensation is not linked to the views expressed. CFC’s research and marketing divisions operate independently.
Trading Risk Warning:
Trading in financial products involves significant risk. Leveraged OTC derivatives, such as Contracts for Difference (CFDs) and spot forex contracts, carry a high risk of loss that can potentially exceed initial deposits and may not be suitable for all investors. These instruments do not confer ownership of underlying assets. Investors must carefully evaluate their investment objectives and risk tolerance, and consult independent advisors where appropriate.
__706859886.jpg)



Regulated by CMA
Century Financial Consultancy LLC








Reach us:
-
Dubai
6th Floor, Emaar Square Building 4,
Downtown, Dubai, P.O. Box 65777,
Dubai, United Arab Emirates -
Abu Dhabi
27th Floor, Office 2701,
Shining Towers, Abu Dhabi, UAE -
Sharjah
29th Floor, Office 2905,
The Business Tower, Sharjah, UAE - +971 (4) 356 2800
- info@century.ae

Disclaimer: Trading in financial products carries substantial risk. Leveraged over-the-counter (OTC) derivatives, such as Contracts for Difference (CFDs) and spot forex, may result in losses exceeding initial deposits and may not be suitable for all investors. These complex instruments do not confer ownership of the underlying assets. Investors should carefully consider their investment objectives and risk appetite, and seek independent professional advice if necessary.
Century Financial Consultancy LLC (CFC) is licensed and regulated by the Capital Market Authority (CMA) of the UAE under license numbers 20200000028 and 301044 to carry out the activities of Financial Products dealer, Trading Broker in international markets, Trading Broker of OTC derivatives and currencies in the spot market, Introduction, Financial Consultations, and Promotion. CFC is incorporated under UAE law, registered with the Dubai Economic Department (No. 768189), with its office at 601, Level 6, Building No. 4, Emaar Square, Downtown Dubai, UAE, PO Box 65777.
The content on this website is provided solely for informational and educational purposes and does not constitute an offer, recommendation, or solicitation to buy or sell any securities or financial products.
Products and services offered by CFC are not intended for use in any jurisdiction where such use or distribution would breach local laws or regulatory requirements.
⚠️ Alert: Fraudulent Activity Notice
Century Financial Consultancy LLC (“Century”) has become aware of fraudulent individuals and entities impersonating our firm through unofficial websites, social media channels, and messaging applications such as Telegram, WhatsApp, and Discord.
Please be advised:
- Century does not manage investments on behalf of clients.
- Century does not solicit funds or guarantee investment returns.
- Century does not accept or make payments in cash, cryptocurrency, or digital assets.
- We do not conduct business via social media or messaging platforms.
Our only official website is www.century.ae, and all communication is conducted exclusively through verified channels.
We strongly urge the public to remain vigilant, verify the authenticity of any communication claiming to be from Century, and report any suspicious activity. Century disclaims any responsibility for losses arising from dealings with unauthorised or fraudulent parties.
