Monday, April 13, 2026
Oil Shocks and Market Performance in Past Geopolitical Events
By Century Financial in 'Investment Insights'
__787607846.png)
.png)
Oil Shocks and Market Performance in Past Geopolitical Events
A comparative analysis of crude oil price shocks and eventual S&P 500 recovery across three major geopolitical conflicts — examining how wartime commodity spikes unfolded and how equity markets ultimately found their footing.
Commodity
Brent Crude Oil (USD/bbl)
Equity Index
S&P 500 (SPX)
Conflicts Covered
Gulf War · Iraq War · Russia–Ukraine War
Data Source
Bloomberg
Headline Figures — All Three Conflicts
Gulf War · 1990–1991
+161.3%
Oil Price Rise
$15.75 → $41.15 79 days to peak
−15.3%
S&P 500 Drawdown
$361.23→$306.05
+19.3%
S&P 500 Recovery
→$364.97 146 days
Iraq War · 2003
+14.1%
Oil Price Rise
$30.62 → $34.93 39 days to peak
−2.2%
S&P 500 Drawdown
$847.48→$828.89
+5.6%
S&P 500 Recovery
→$875.67 13 days
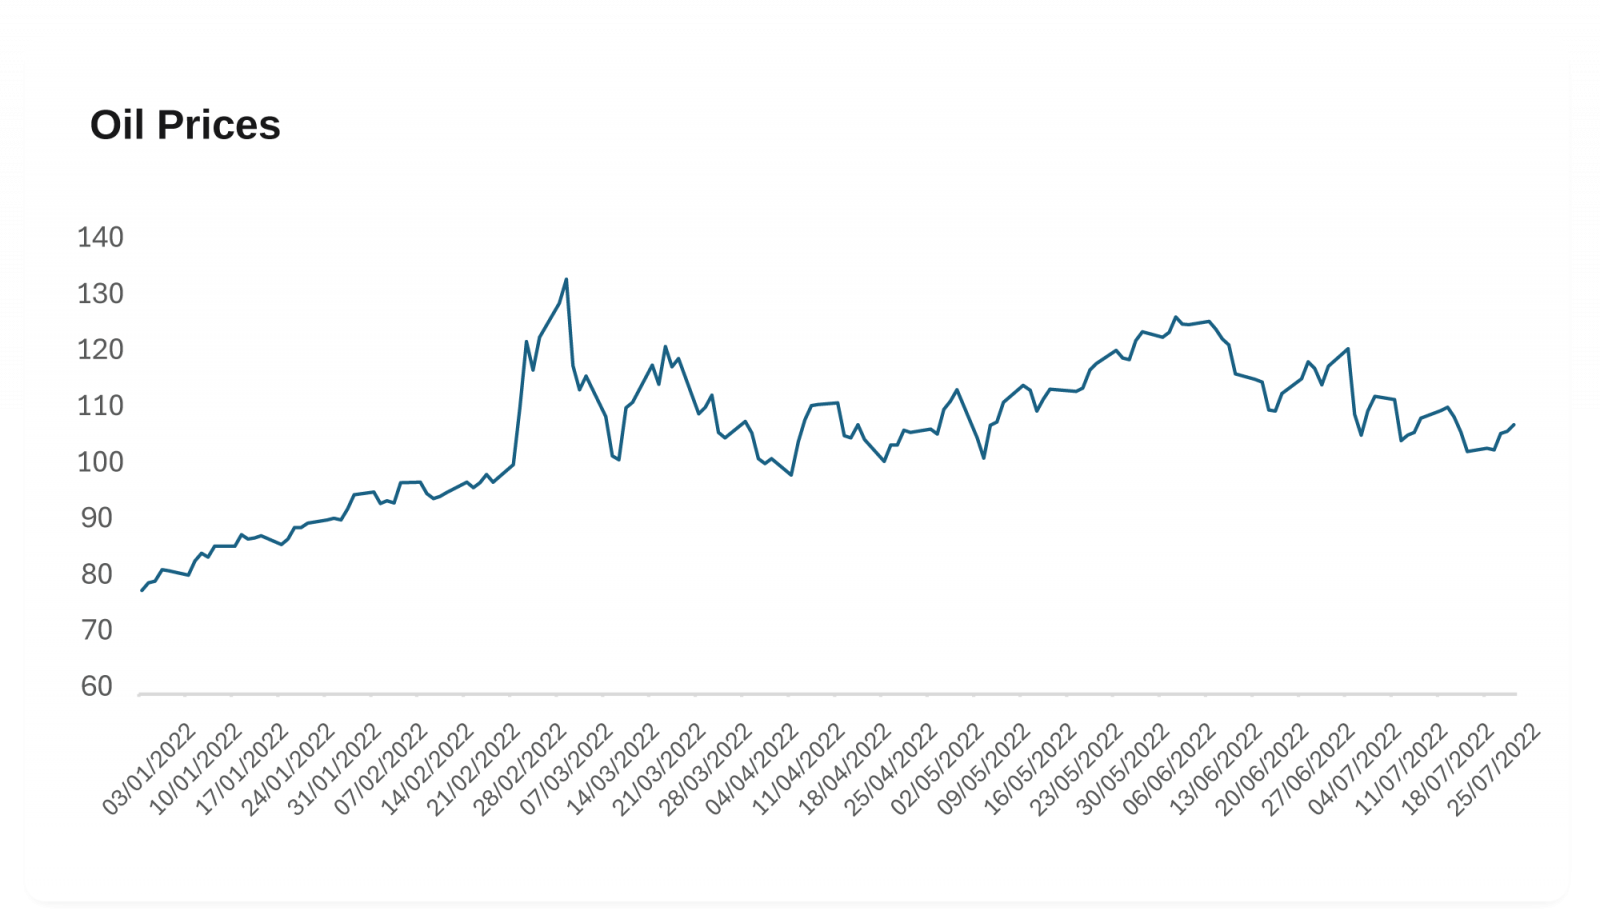
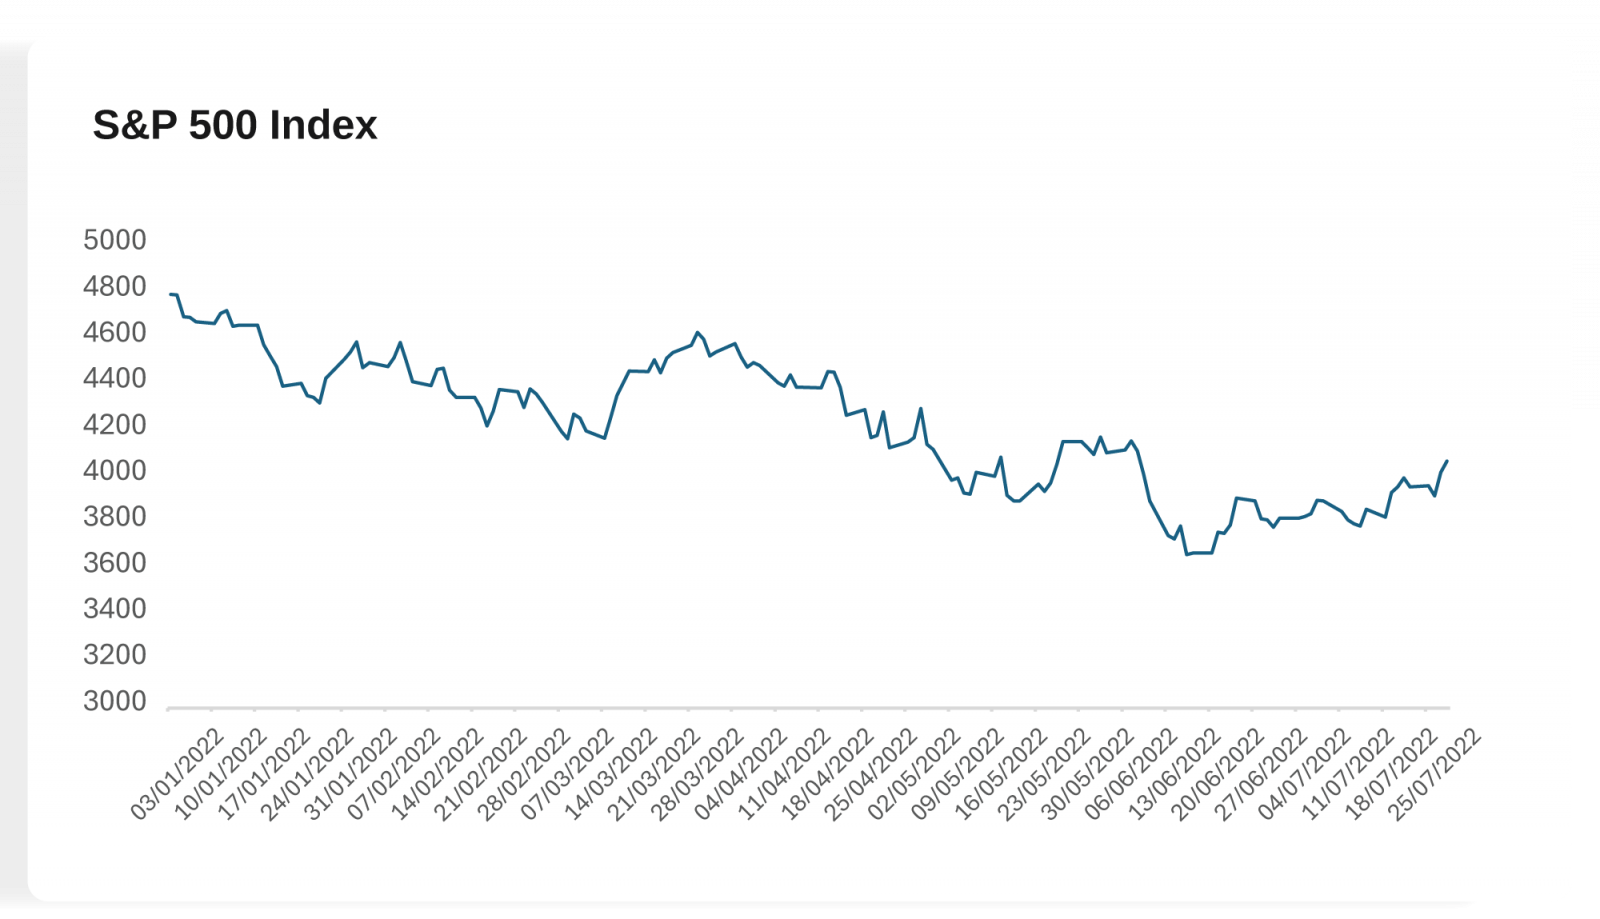
Russia–Ukraine War · 2022–Ongoing
+47.1%
Oil Price Rise
$91.01 → $133.89 34 days to peak
−9.1%
S&P 500 Drawdown
$4,589.38→$4,170.70
+11.05%
S&P 500 Recovery
→$4,631.6 21 days
- 1 Pre-war price is taken as of 2–3 weeks before the war starts. This helps to stabilise prices and capture the full up-move in oil.
- 2 The Iraq War continued until 2011. Only the initial phase of the war's start has been taken for the purpose of this analysis. Oil prices surged to $147 per barrel in July 2008 before collapsing to under $40 by December. Over $60 billion in speculative investment drove prices from $95 to $147 in the first half of 2008, while supply disruptions in Venezuela, Iraq, and Nigeria and surging demand from China and India exacerbated the spike.
- 3 The Russia–Ukraine war remains ongoing; however, this analysis focuses only on the initial phase following the outbreak. The S&P 500 recovered to its pre-conflict levels within just 21 days, but subsequently entered a prolonged decline driven by the broader 2022 bear market, largely triggered by aggressive Federal Reserve rate hikes to curb inflation.
- 4 The calculation for S&P 500 recovery is done based on how soon the index is able to recapture its level that was observed prior to the outbreak of the war.
Data Source: Bloomberg (Brent Crude Oil; SPX Index — S&P 500). All prices in USD. This material is for informational purposes only and does not constitute investment advice.
Oil prices are often among the first to react when geopolitical tensions escalate, especially when major energy-producing regions are involved. During major geopolitical shocks such as the Gulf War, the Iraq War, and the ongoing Russia–Ukraine conflict, oil prices have typically risen sharply as markets factor in the risk of supply disruptions. Whenever conflict threatens major energy-producing regions, pipelines, or key shipping routes, traders quickly price in the possibility that global oil supplies could tighten. Even before any actual supply is lost, concerns around damaged infrastructure, reduced production, or disruptions to vital transport routes can add a geopolitical risk premium to crude prices, pushing them higher in the short term.
At the same time, history suggests that these shocks are often temporary. While equity markets typically come under pressure when oil prices spike and uncertainty rises, they have tended to stabilise and recover once energy markets find a floor and supply concerns begin to ease. Looking back at these three major geopolitical episodes helps illustrate how oil prices have reacted during periods of conflict and how global markets have historically responded once the initial shock fades and conditions gradually normalise.
The Gulf War (1990–1991)
2 August 1990 – 28 February 1991 · Pre-war reference: 11 July 1990
The Persian Gulf War (1990–1991) was triggered by Iraq's invasion of Kuwait in August 1990. Though Iraqi leader Saddam Hussein justified the invasion on the grounds that Kuwait was historically part of Iraq, it was widely presumed to be motivated by Iraq's desire to acquire Kuwait's rich oil fields and expand its regional power. The United States, acting under UN auspices and fearing Iraq's broader strategic ambitions, formed a broad multinational coalition — including a number of Arab countries — and began massing troops in northern Saudi Arabia.
The invasion had an immediate worldwide impact on energy markets. In response, the UN imposed an embargo on Iraq and Kuwait, reducing global oil supply by approximately 4.3 million barrels per day — roughly 7% of world production. The sudden supply shock caused oil prices to double, from $17/bbl in early 1990 to $40/bbl by October 1990.
Pre-War Oil Price
$15.75
11 Jul 1990
Peak Oil Price
$41.15
28 Sep 1990 (79 days later)
Oil Price Rise
+161.3%
Largest spike of all 3 conflicts
S&P 500 Pre-War
$361.23
11 Jul 1990
S&P 500 Drawdown
−15.3%
$306.05 at oil peak
S&P 500 Recovery
+19.3%
$364.97 · 21 Feb 1991 · 146 days
Gulf War — Key Inferences
- 01
Oil markets reacted extremely sharply as Iraq invaded Kuwait, triggering fears of major supply disruptions in the Middle East. Crude prices surged from $15.75/bbl on 11 July 1990 to $41.15 by 28 September — a rise of roughly 161% in just 79 days.
- 02
Equity markets struggled during the period of uncertainty. The S&P 500 fell from $361.23 to $306.05, representing a drawdown of about 15.3% as investors priced in the economic risks of a prolonged conflict and higher energy costs.
- 03
Once the situation began to stabilise and oil prices peaked, market sentiment gradually improved. The S&P 500 eventually recovered to $364.97, marking a rebound of around 19% from the lows.
- 04
The full recovery took 146 days, illustrating how markets often require several months to regain confidence after a large geopolitical shock and energy spike.
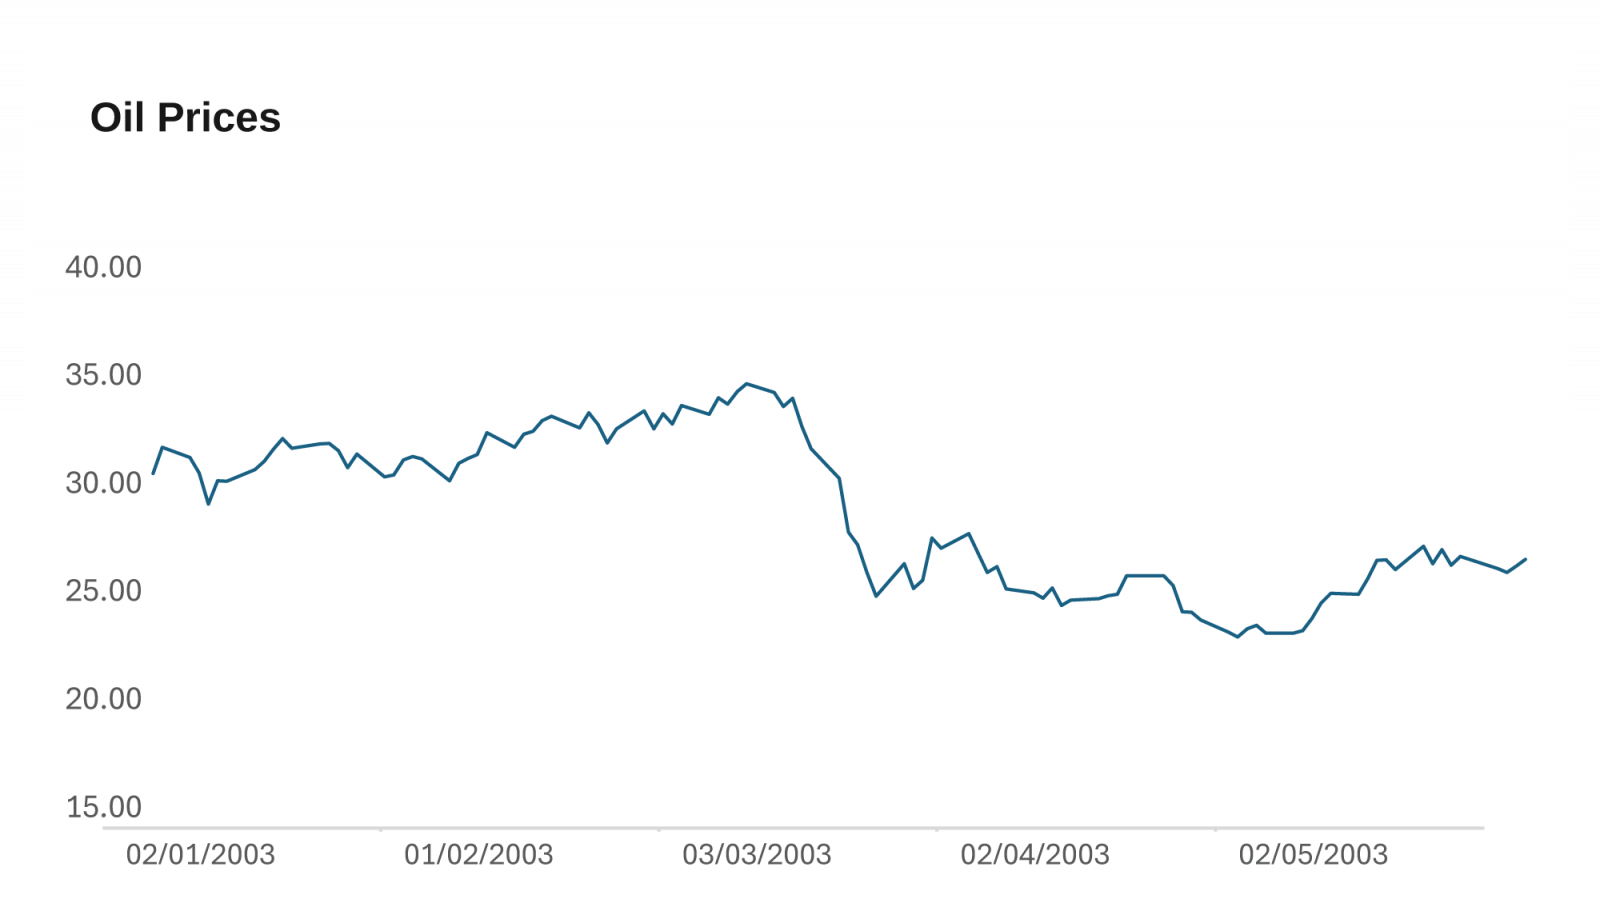
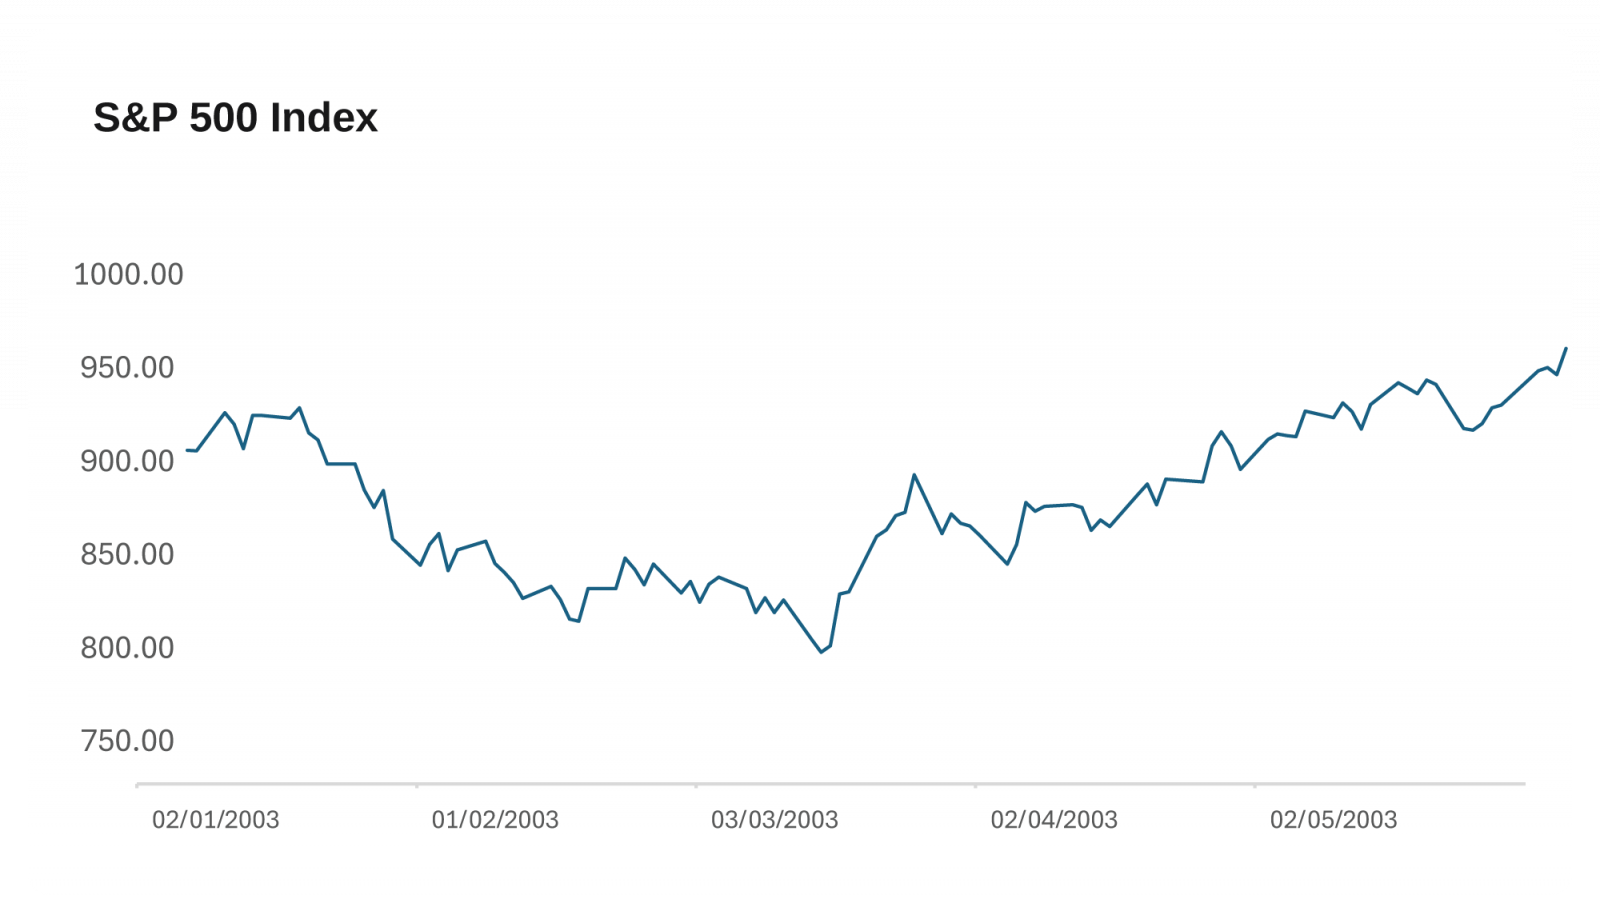
The Iraq War (2003)
20 March 2003 – 1 May 2003 (initial phase analysed) · Pre-war reference: 27 January 2003
The Iraq War began on 20 March 2003, after a US-led coalition launched military operations against Iraq following months of rising tensions over allegations that Saddam Hussein's government possessed weapons of mass destruction. In the run-up to the invasion, oil markets had already begun factoring in the risk of supply disruptions, particularly given that Iraq was producing around 2–2.5 million barrels per day at the time. As uncertainty around the conflict grew, traders began building a geopolitical risk premium into crude prices, anticipating the possibility that production or exports from the region could be affected.
However, once the invasion actually began, markets quickly reassessed the situation. It became clear that most Iraqi oil fields were secured relatively quickly and that wider supply disruptions across the region were unlikely. As a result, the geopolitical risk premium that had built up in the weeks before the war began to fade. Additional production from OPEC members and recovering supply from Venezuela also helped calm the market, allowing oil prices to retreat back toward the mid-$20s/bbl in the weeks that followed.
In many ways, the episode illustrates a pattern often seen during geopolitical crises: oil prices tend to rally ahead of uncertain events as markets price in worst-case scenarios, but once the situation becomes clearer, that risk premium frequently unwinds.
Pre-War Oil Price
$30.62
27 Jan 2003
Peak Oil Price
$34.93
7 Mar 2003 (39 days later)
Oil Price Rise
+14.1%
War largely priced in pre-invasion
S&P 500 Pre-War
$847.48
27 Jan 2003
S&P 500 Drawdown
−2.2%
$828.89 at oil peak
S&P 500 Recovery
+5.6%
$875.67 · 20 Mar 2003 · 13 days
Iraq War — Key Inferences
- 01
In the lead-up to the war, oil markets priced in a geopolitical risk premium, but the move was far more modest than during the Gulf War. Prices rose from $30.62 on 27 January 2003 to $34.93 by 7 March — an increase of roughly 14% over 39 days.
- 02
Equity markets showed comparatively strong resilience. The S&P 500 slipped from $847.48 to $828.89, a relatively mild decline of about 2.2%, reflecting the fact that investors expected a swift military campaign.
- 03
Once the invasion began and uncertainty faded, markets quickly stabilised. The S&P 500 rebounded to $875.67, representing a recovery of about 5.6% from the trough.
- 04
Notably, the market recovered in just 13 days, highlighting how quickly risk premiums can unwind when geopolitical fears fail to translate into sustained supply disruptions.
The Russia–Ukraine War (2022–Ongoing)
24 February 2022 – Present · Pre-war reference: 2 February 2022
The Russia–Ukraine war, which broke out on 24 February 2022, has persisted for more than four years. This conflict and its consequent chain of events have adversely impacted the global economy through several channels — the commodity market, stock market, and trade flows. Notably, the energy market was hit the hardest, given that Russia is the world's third-largest oil producer. The eruption of the war and subsequent US energy sanctions imposed on Russia resulted in a significant surge in crude oil prices.
The subsequent consequences of the war were far-reaching: rapidly rising global inflation prompted multiple central banks to raise interest rates sharply across the world. This combination of an energy shock and aggressive monetary tightening created a prolonged and challenging environment for equities — one that proved materially different from the sharper but shorter dislocations seen in prior conflicts.
Pre-War Oil Price
$91.01
2 Feb 2022
Peak Oil Price
$133.89
8 Mar 2022 (34 days later)
Oil Price Rise
+47.1%
Fastest spike to peak of all 3
S&P 500 Pre-War
$4,589.38
2 Feb 2022
S&P 500 Drawdown
−9.1%
$4,170.70 at oil peak
S&P 500 Recovery
+11.05%
$4,631.6 · 29 Mar 2022 · 21 days
Russia–Ukraine War — Key Inferences
- 01
The invasion of Ukraine triggered a major shock to global energy markets, given Russia's role as one of the world's largest oil and gas exporters. Crude prices climbed from $91.01 on 2 February 2022 to $133.89 by 8 March — a 47% surge in just 34 days.
- 02
Equity markets reacted negatively to the sudden spike in energy prices and the broader macro backdrop. The S&P 500 declined from $4,589.38 to $4,170.70, a drawdown of roughly 9.1% during the early phase of the conflict.
- 03
Despite the initial sell-off, markets eventually stabilised as energy prices moderated and supply disruptions proved manageable. The S&P 500 later recovered to $4,631.6, marking a rebound of around 11.05% from the lows.
- 04
The S&P 500 index recaptured its pre-conflict level within a span of 21 days. However, that proved short-lived. The markets then declined after the Fed embarked on its monetary tightening spree to combat inflationary pressures, thereby causing a bear market in 2022.
Key Insight — Average Days for Oil to Peak
~51 Calendar Days
Across all three conflicts, crude oil reached its wartime price peak in an average of approximately 51 days from the pre-war reference price. The speed of the spike has accelerated with each successive conflict (79, 39 & 34 days), reflecting increasingly financialised commodity markets. The magnitude of each spike, however, has varied considerably — driven by the scale of supply disruption, the availability of spare capacity, and the broader macro backdrop at the time of each conflict.
Side-by-Side Comparison
All figures sourced directly from Bloomberg (Brent Crude Oil; SPX Index — S&P 500).
| Metric | Gulf War (1990–91) | Iraq War (2003) | Russia–Ukraine (2022–Ongoing) |
|---|---|---|---|
| Pre-War Oil Price | $15.75/bbl | $30.62/bbl | $91.01/bbl |
| Peak Oil Price | $41.15/bbl | $34.93/bbl | $133.89/bbl |
| Oil Price Rise | +161.3% | +14.1% | +47.1% |
| Days to Oil Peak | 79 days | 39 days | 34 days |
| S&P 500 Pre-War | $361.23 | $847.48 | $4,589.38 |
| S&P 500 at Oil Peak | $306.05 (−15.3%) | $828.89 (−2.2%) | $4,170.70 (−9.1%) |
| S&P 500 Recovery | $364.97 (+19.3%) | $875.67 (+5.6%) | $4,631.6 (+11.05%) |
| Days to SPX Recovery | 146 days | 13 days | 21 days |
| SPX Recovery Date | 21 Feb 1991 | 20 Mar 2003 | 29 March 2022 |
Data Source: Bloomberg (Brent Crude Oil; SPX Index — S&P 500). All prices in USD.
Disclaimer: This material is for informational purposes only and does not constitute investment advice. Past market behaviour during geopolitical events is not indicative of future results. See methodology notes above the analysis for full footnotes.
Risks and Assumptions related to Back-tested trading strategies
Disclaimer: Century Financial Consultancy LLC (CFC) is licensed and regulated by the Capital Market Authority (CMA) of the UAE under license numbers 20200000028 and 301044 to carry out the activities of Financial Products dealer, Trading Broker in international markets, Trading Broker of OTC derivatives and currencies in the spot market, Introduction, Financial Consultations, and Promotion. CFC is incorporated under UAE law, registered with the Dubai Economic Department (No. 768189), with its office at 601, Level 6, Building No. 4, Emaar Square, Downtown Dubai, UAE, PO Box 65777.
Terms and Conditions of Access
By accessing and continuing to use the Publication (which includes this document, flyer, charts, diagrams,
illustrations, images, calculations, scenario analysis, and related data or content), you confirm that you
have read, understood, and agreed to the terms of this Disclaimer.
CFC reserves the right to amend or update the Publication and this Disclaimer at any time without prior
notice. Continued use following any such update constitutes your acceptance of the revised terms. If you do
not agree with these terms, please discontinue use of the Publication.
Purpose and Intended Use
This Publication is classified as marketing material and should not be regarded as independent investment
research. It is provided for informational, educational, and illustrative purposes only and does not
constitute investment advice, a recommendation, an offer, or a solicitation to buy or sell any financial
instruments or services. All views expressed are general market commentary and may not reflect the opinions of
CFC as a whole.
Risk Disclosures and Limitations
The information presented does not cover all the risks associated with the products or scenarios discussed.
Please refer to the full Risk
Disclosure Statement available on our website.
This Publication reflects information available at the time of preparation and does not account for subsequent
developments. Any forward-looking statements involve assumptions and uncertainties; actual outcomes may differ
materially. CFC does not guarantee the accuracy, completeness, or reliability of the information and disclaims
liability for any action taken based on it.
No Offer or Contractual Commitment
No part of this Publication constitutes an offer, agreement, or commitment to enter into any transaction.
Distribution of this Publication does not oblige CFC to engage in any trade or provide any services. Product
names or terms may differ across platforms or providers. This material should not be interpreted as legal,
regulatory, tax, accounting, or credit advice. Recipients should seek independent professional advice and
assess their own financial situation, objectives, and risk profile before making investment decisions.
Data Sources and Interpretation
This Publication may rely on publicly available data, third-party information, or model-based assumptions. CFC
makes no representation or warranty as to their accuracy or completeness. Data limitations, errors, or
outdated inputs may impact the reliability of projections or scenarios. Names of financial products may differ
from those used on trading platforms.
Use, Reproduction, and Analyst Disclosure
This Publication is intended solely for the recipient’s informational use. It may not be copied, transmitted,
or distributed in any form, wholly or partially, without prior written permission from CFC.
Analyst Declaration: The Analyst(s) certifies that all opinions expressed in this Publication represent their own independent views and that reasonable care was taken to ensure objectivity. They do not hold securities in the companies mentioned, and their compensation is not linked to the views expressed. CFC’s research and marketing divisions operate independently.
Trading Risk Warning:
Trading in financial products involves significant risk. Leveraged OTC derivatives, such as Contracts for
Difference (CFDs) and spot forex contracts, carry a high risk of loss that can potentially exceed initial
deposits and may not be suitable for all investors. These instruments do not confer ownership of underlying
assets. Investors must carefully evaluate their investment objectives and risk tolerance, and consult
independent advisors where appropriate.

__104366112.jpg)
__691742582.jpg)


Regulated by CMA
Century Financial Consultancy LLC


.png)
.png)
.png)
.png)
.png)

Reach us:
-
Dubai
6th Floor, Emaar Square Building 4,
Downtown, Dubai, P.O. Box 65777,
Dubai, United Arab Emirates -
Abu Dhabi
27th Floor, Office 2701,
Shining Towers, Abu Dhabi, UAE -
Sharjah
29th Floor, Office 2905,
The Business Tower, Sharjah, UAE - +971 (4) 356 2800
- info@century.ae

Disclaimer: Trading in financial products carries substantial risk. Leveraged over-the-counter (OTC) derivatives, such as Contracts for Difference (CFDs) and spot forex, may result in losses exceeding initial deposits and may not be suitable for all investors. These complex instruments do not confer ownership of the underlying assets. Investors should carefully consider their investment objectives and risk appetite, and seek independent professional advice if necessary.
Century Financial Consultancy LLC (CFC) is licensed and regulated by the Capital Market Authority (CMA) of the UAE under license numbers 20200000028 and 301044 to carry out the activities of Financial Products dealer, Trading Broker in international markets, Trading Broker of OTC derivatives and currencies in the spot market, Introduction, Financial Consultations, and Promotion. CFC is incorporated under UAE law, registered with the Dubai Economic Department (No. 768189), with its office at 601, Level 6, Building No. 4, Emaar Square, Downtown Dubai, UAE, PO Box 65777.
The content on this website is provided solely for informational and educational purposes and does not constitute an offer, recommendation, or solicitation to buy or sell any securities or financial products.
Products and services offered by CFC are not intended for use in any jurisdiction where such use or distribution would breach local laws or regulatory requirements.
⚠️ Alert: Fraudulent Activity Notice
Century Financial Consultancy LLC (“Century”) has become aware of fraudulent individuals and entities impersonating our firm through unofficial websites, social media channels, and messaging applications such as Telegram, WhatsApp, and Discord.
Please be advised:
- Century does not manage investments on behalf of clients.
- Century does not solicit funds or guarantee investment returns.
- Century does not accept or make payments in cash, cryptocurrency, or digital assets.
- We do not conduct business via social media or messaging platforms.
Our only official website is www.century.ae, and all communication is conducted exclusively through verified channels.
We strongly urge the public to remain vigilant, verify the authenticity of any communication claiming to be from Century, and report any suspicious activity. Century disclaims any responsibility for losses arising from dealings with unauthorised or fraudulent parties.
