Tuesday, April 14, 2026
Natural Gas Disruption: Strategic Beneficiaries
By Century Financial in 'Investment Insights'

Brief Overview
| Name | Ticker | 52 W Low ($) | "Last Price ($) | 52 W High ($) | Market Capitalization ($ Billion) | Beta |
|---|---|---|---|---|---|---|
| EQT Corp | EQT | $43.57 | $64.31 | $65.34 | $40.15 | 0.78 |
| Antero Resources Corp | AR | $29.10 | $41.03 | $44.02 | $12.66 | 0.70 |
| Cheniere Energy Inc | LNG | $186.20 | $251.29 | $259.24 | $52.82 | 0.50 |
| Venture Global Inc | VG | $5.72 | $12.28 | $19.50 | $30.18 | 1.24 |
| Sempra | SRE | $61.90 | $95.94 | $97.45 | $62.68 | 0.61 |
| Chevron Corp | CVX | $132.04 | $196.84 | $198.88 | $392.77 | 0.49 |
Pair Trade Stocks Snapshot
| Pair Trade | Stock Name | 52 W Low($) | *Last Price ($) | 52 W High($) | Market Capitalization ($ Billion) | Beta |
|---|---|---|---|---|---|---|
| Long | Cheniere Energy Inc (LNG) | $186.20 | $251.29 | $259.24 | $52.82 | 0.50 |
| Short | Enel SpA (ENEL) | € 6.70 | € 9.65 | € 10.31 | € 98.13 | 0.66 |
Source: Bloomberg
*Last price as of 16th March 2026
Global Natural Gas Supply Shock
The ongoing US–Iran–Israel conflict in the Middle East is disrupting global energy markets, particularly in the Strait of Hormuz, a key corridor that handles about 20% of global oil and LNG shipments. Military escalation has reduced tanker traffic and created uncertainty for regional exports. At the same time, Qatar’s LNG exports have collapsed, intensifying the supply shock. Qatar, the second-largest LNG exporter, normally supplies around 20% of global LNG, mainly to Asia. Exports have fallen nearly 90% since February, reaching the lowest levels since the 2008 Financial Crisis. Regional disruptions could remove 1.65 million tonnes of LNG per week, roughly 20% of global LNG trade, tightening markets as China, India, Taiwan and Pakistan compete with Europe for cargoes.
Why US Is Well Positioned
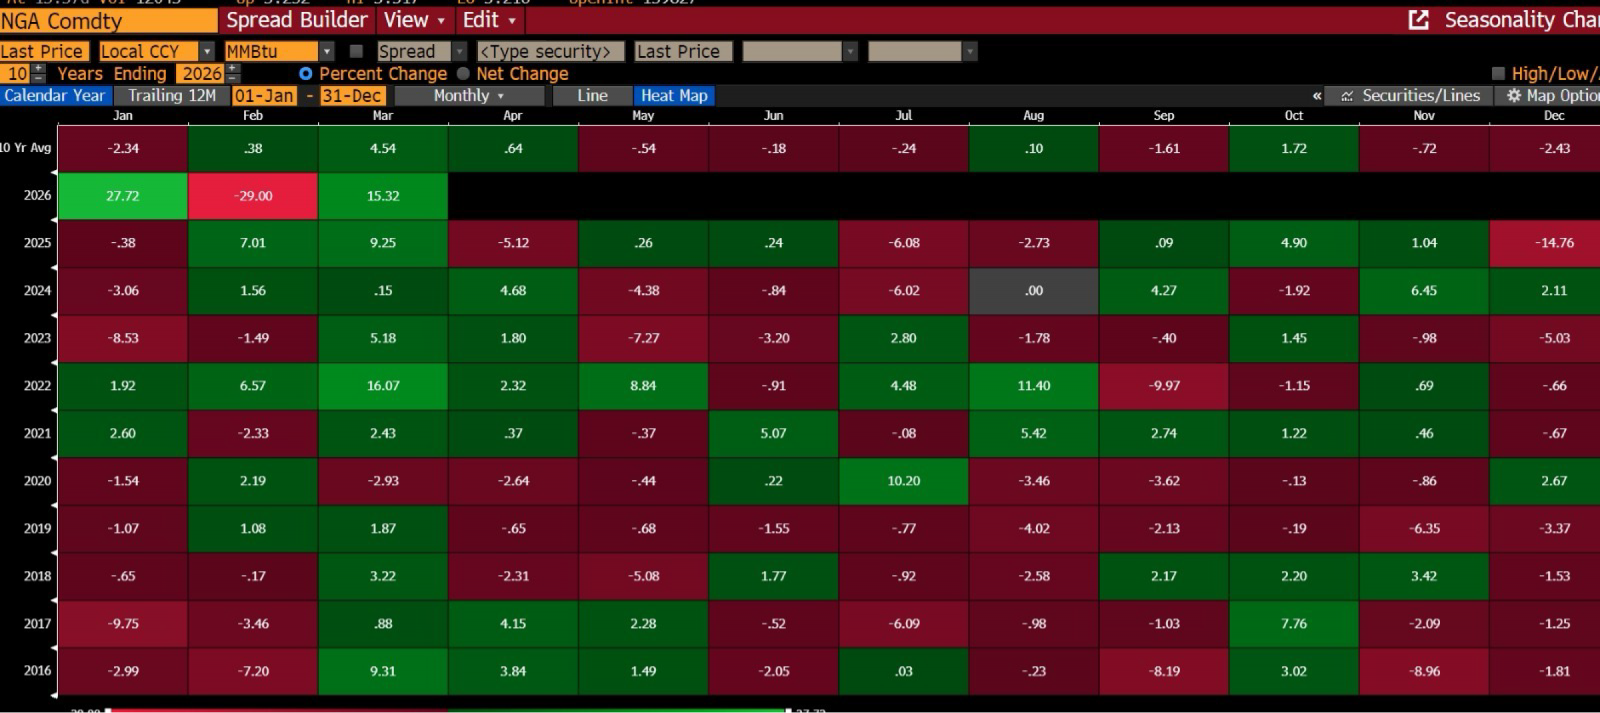
Seasonality
The seasonality chart shows that March has historically been a supportive month for natural gas prices. Over the past decade, the month has delivered a strong average performance of around 4.54%, making it one of the more consistently positive months in the calendar. This seasonal strength often reflects late-winter demand dynamics and tightening supply expectations. Overall, historical trends indicate that March tends to be a relatively favourable period for natural gas price performance compared with many other months of the year.
Direct Stock Beneficiaries
Since February 27, European TTF gas is up ~60%, and Asian JKM is up ~70%, while U.S. Henry Hub is up only ~9%, highlighting strong upside as export demand grows.
Higher global LNG prices benefit Cheniere, just to a smaller degree than its competitor, Venture Global. Every dollar-per-million-BTU change in market margin can affect Ebitda by slightly less than $50 million this year, according to management. Yet, the sudden price surge may let it reach, or even top, the high end of the $6.75-$7.25 billion guidance. Cheniere has roughly 2 million tons of commissioning volume, or unsold capacity, for 2026, which may drive spot prices higher.
EQT Corporation is the largest natural gas producer in the US, with over 90% of its production from the Appalachian Basin (Ohio, Pennsylvania, and West Virginia), positioning the company as a key beneficiary of rising gas prices.
Antero Resources is a major Appalachian Basin producer focused on natural gas and NGLs from the Marcellus and Utica shales, with strong export exposure and integrated midstream support through Antero Midstream, positioning the company to benefit from rising global natural gas demand.
Chevron has the lowest exposure to upstream operations in the Persian Gulf, with its Kuwaiti interests comprising less than 2% of its global production of 4 million barrels per day. Chevron's LNG portfolio resides exclusively outside the Persian Gulf, with its long-term contracts to see oil-indexed price expansion with a 3-4 month lag, and US off-take volume capturing LNG spot price upside.
Pair Trade Idea
.png)
Long Cheniere Energy Inc (LNG) / Short Enel S.p.A. (ENEL)
This is essentially a play going long on a US-based LNG exporter and short on a European utility firm.
Fundamentals
LNG benefits from the following on the long side.
Here are the following reasons to short Enel
- Gas procurement costs on unhedged volumes spike today
- Retail repricing happens 6-12 months from now
- Every month of that lag is margin destruction that cannot be recovered in the current contract cycle
Overall, the trade also benefits from a currency perspective, as the USD strengthens as a safe haven.
Technicals
Risks and Assumptions related to Back-tested trading strategies
Disclaimer: Century Financial Consultancy LLC (CFC) is licensed and regulated by the Capital Market Authority (CMA) of the UAE under license numbers 20200000028 and 301044 to carry out the activities of Financial Products dealer, Trading Broker in international markets, Trading Broker of OTC derivatives and currencies in the spot market, Introduction, Financial Consultations, and Promotion. CFC is incorporated under UAE law, registered with the Dubai Economic Department (No. 768189), with its office at 601, Level 6, Building No. 4, Emaar Square, Downtown Dubai, UAE, PO Box 65777.
Terms and Conditions of Access
By accessing and continuing to use the Publication (which includes this document, flyer, charts, diagrams, illustrations, images, calculations, scenario analysis, and related data or content), you confirm that you have read, understood, and agreed to the terms of this Disclaimer.
CFC reserves the right to amend or update the Publication and this Disclaimer at any time without prior notice. Continued use following any such update constitutes your acceptance of the revised terms. If you do not agree with these terms, please discontinue use of the Publication.
Purpose and Intended Use
This Publication is classified as marketing material and should not be regarded as independent investment research. It is provided for informational, educational, and illustrative purposes only and does not constitute investment advice, a recommendation, an offer, or a solicitation to buy or sell any financial instruments or services. All views expressed are general market commentary and may not reflect the opinions of CFC as a whole.
Risk Disclosures and Limitations
The information presented does not cover all the risks associated with the products or scenarios discussed. Please refer to the full Risk Disclosure Statement available on our website.
This Publication reflects information available at the time of preparation and does not account for subsequent developments. Any forward-looking statements involve assumptions and uncertainties; actual outcomes may differ materially. CFC does not guarantee the accuracy, completeness, or reliability of the information and disclaims liability for any action taken based on it.
No Offer or Contractual Commitment
No part of this Publication constitutes an offer, agreement, or commitment to enter into any transaction. Distribution of this Publication does not oblige CFC to engage in any trade or provide any services. Product names or terms may differ across platforms or providers. This material should not be interpreted as legal, regulatory, tax, accounting, or credit advice. Recipients should seek independent professional advice and assess their own financial situation, objectives, and risk profile before making investment decisions.
Data Sources and Interpretation
This Publication may rely on publicly available data, third-party information, or model-based assumptions. CFC makes no representation or warranty as to their accuracy or completeness. Data limitations, errors, or outdated inputs may impact the reliability of projections or scenarios. Names of financial products may differ from those used on trading platforms.
Use, Reproduction, and Analyst Disclosure
This Publication is intended solely for the recipient’s informational use. It may not be copied, transmitted, or distributed in any form, wholly or partially, without prior written permission from CFC.
Analyst Declaration: The Analyst(s) certifies that all opinions expressed in this Publication represent their own independent views and that reasonable care was taken to ensure objectivity. They do not hold securities in the companies mentioned, and their compensation is not linked to the views expressed. CFC’s research and marketing divisions operate independently.
Trading Risk Warning:
Trading in financial products involves significant risk. Leveraged OTC derivatives, such as Contracts for Difference (CFDs) and spot forex contracts, carry a high risk of loss that can potentially exceed initial deposits and may not be suitable for all investors. These instruments do not confer ownership of underlying assets. Investors must carefully evaluate their investment objectives and risk tolerance, and consult independent advisors where appropriate.


Regulated by CMA
Century Financial Consultancy LLC


.png)
.png)
.png)
.png)
.png)

Reach us:
-
Dubai
6th Floor, Emaar Square Building 4,
Downtown, Dubai, P.O. Box 65777,
Dubai, United Arab Emirates -
Abu Dhabi
27th Floor, Office 2701,
Shining Towers, Abu Dhabi, UAE -
Sharjah
29th Floor, Office 2905,
The Business Tower, Sharjah, UAE - +971 (4) 356 2800
- info@century.ae

Disclaimer: Trading in financial products carries substantial risk. Leveraged over-the-counter (OTC) derivatives, such as Contracts for Difference (CFDs) and spot forex, may result in losses exceeding initial deposits and may not be suitable for all investors. These complex instruments do not confer ownership of the underlying assets. Investors should carefully consider their investment objectives and risk appetite, and seek independent professional advice if necessary.
Century Financial Consultancy LLC (CFC) is licensed and regulated by the Capital Market Authority (CMA) of the UAE under license numbers 20200000028 and 301044 to carry out the activities of Financial Products dealer, Trading Broker in international markets, Trading Broker of OTC derivatives and currencies in the spot market, Introduction, Financial Consultations, and Promotion. CFC is incorporated under UAE law, registered with the Dubai Economic Department (No. 768189), with its office at 601, Level 6, Building No. 4, Emaar Square, Downtown Dubai, UAE, PO Box 65777.
The content on this website is provided solely for informational and educational purposes and does not constitute an offer, recommendation, or solicitation to buy or sell any securities or financial products.
Products and services offered by CFC are not intended for use in any jurisdiction where such use or distribution would breach local laws or regulatory requirements.
⚠️ Alert: Fraudulent Activity Notice
Century Financial Consultancy LLC (“Century”) has become aware of fraudulent individuals and entities impersonating our firm through unofficial websites, social media channels, and messaging applications such as Telegram, WhatsApp, and Discord.
Please be advised:
- Century does not manage investments on behalf of clients.
- Century does not solicit funds or guarantee investment returns.
- Century does not accept or make payments in cash, cryptocurrency, or digital assets.
- We do not conduct business via social media or messaging platforms.
Our only official website is www.century.ae, and all communication is conducted exclusively through verified channels.
We strongly urge the public to remain vigilant, verify the authenticity of any communication claiming to be from Century, and report any suspicious activity. Century disclaims any responsibility for losses arising from dealings with unauthorised or fraudulent parties.
