Tuesday, April 14, 2026
Strait to the Point: Commodities as an Inflation Hedge
By Century Financial in 'Investment Insights'
__452235344.png)
.png)
A brief overview of the report
| Name | Ticker | Market Capitalization ($ Billion) |
52 Week Low ($) |
Current Price ($) |
52 Week High ($) |
Beta |
|---|---|---|---|---|---|---|
| CF Industries | CF | 20.90 | 67.34 | 136.5 | 137.44 | 0.42 |
| Nutrien | NTR | 55.09 | 45.75 | 83.94 | 85.35 | 0.60 |
| Instrument | Currency | 52 Week Low ($) |
Current Price ($) |
52 Week High ($) |
|---|---|---|---|---|
| Soybean Oil | USD | 64.63 | 65.30 | 65.95 |
| Corn | USD | 368.75 | 448.25 | 490.75 |
| Wheat | USD | 635.00 | 592.25 | 492.25 |
Fertilizer Companies Poised to Benefit
CF Industries is the world’s largest nitrogen fertilizer producer, while Nutrien is the largest fertilizer company globally. Both are positioned in a favourable spot, benefiting from rising global fertiliser prices while maintaining a structural cost advantage.
The logic is simple. Making nitrogen fertilizer requires ammonia, and ammonia is made from natural gas. With the Strait of Hormuz effectively shut, European gas (TTF) has surged past $16/MMBtu and (Henry Hub) is still under $3/MMBtu. CF Industries and Nutrien are both North American Asian benchmarks have followed.Global fertilizer prices are spiking as a result, with NOLA urea jumping 21% in the past 10 days to $570/st FOB NOLA.
CF doesn't feel that pain. The company buys its gas from the US domestic pipeline network at Henry Hub, currently around $3.41/MMBtu. Even with the EIA forecasting a drift toward $4.30 for 2026, that's still a fraction of what European and Asian producers pay. CF's input costs rise modestly while its selling prices surge alongside the global market. That's pure margin expansion. Similarly, Nutrien also buys its natural gas from the US Henry Hub and AECO from Canada, which is traded at a discount to US Natural Gas.
The timing amplifies the thesis. Northern Hemisphere planting begins in April, and nitrogen is non-negotiable for farmers. Unlike potash, which can be skipped in a tough year, nitrogen must be applied annually or yields collapse. Demand is effectively inelastic during the planting season. Cheap gas, expensive fertiliser and captive buyers. CF and Nutrien capture all three.
Since the start of the war, CF Industries has risen by 25% and Nutrien by 13%, further validating the thesis.
If the conflict lasts for as long as 3 months, Crude prices may reach $160, further strengthening the bullish case for the company.
Soybean Oil: A Strategic Pivot
US soy oil faces a demand-supply gap in 2026-27. Government biofuels mandates are forcing a sharp rise in demand, a key competing import has been eliminated by policy, and domestic production cannot keep pace. An ongoing geopolitical crisis adds a near-term price boost.
Demand: Compliance-Driven, Not Discretionary
The EPA's biofuel mandate for 2026-27 requires 78% of all US soy oil to be used for fuel production, up from 48% in 2024. This is legally compelled consumption — US refiners must comply or face penalties. The final rule was submitted for approval in late February and is expected in late March.
Supply: Crush Capacity is the Hard Ceiling
Even running every US crush plant at full capacity, domestic soy oil production in 2026 tops out at ~30.1 billion pounds. After food and feed use (~14 billion pounds), only ~16 billion pounds remain, roughly 2.5 billion pounds short of renewable diesel requires. New plants coming online offer marginal relief, not a fix.
Import Substitution: Chinese UCO Effectively Banned
China supplied 5.4 billion pounds of used cooking oil (UCO) to US renewable diesel producers in 2024, up from just 285 million pounds in 2021. The 2026 amendment to the 45Z tax credit restricts biofuel incentives to North American-origin feedstocks, effectively eliminating Chinese UCO from the programme. That displaced volume has no scalable domestic substitute other than soy oil.
Near-Term Catalyst: Geopolitical Energy Premium
US-Israel strikes on Iran have pushed Brent crude to approximately $100/barrel, with the Strait of Hormuz remaining disrupted. This would increase the demand for biofuels, thereby increasing the demand for soybean oil. Soybean oil is the primary feedstock for renewable diesel, a cleaner-burning fuel that can be used directly in any engine without modification. With crude elevated post-conflict, demand has intensified as refiners and fleet operators seek cheaper alternatives
Supply-Side Risks
Cargill's suspension of Brazilian soybean exports to China, combined with urea prices rising 28% to a three-year high, risks simultaneously redirecting Chinese procurement toward the US and constraining the 2026 planted acreage response, limiting any near-term supply-side correction.
Soy and Associated Products
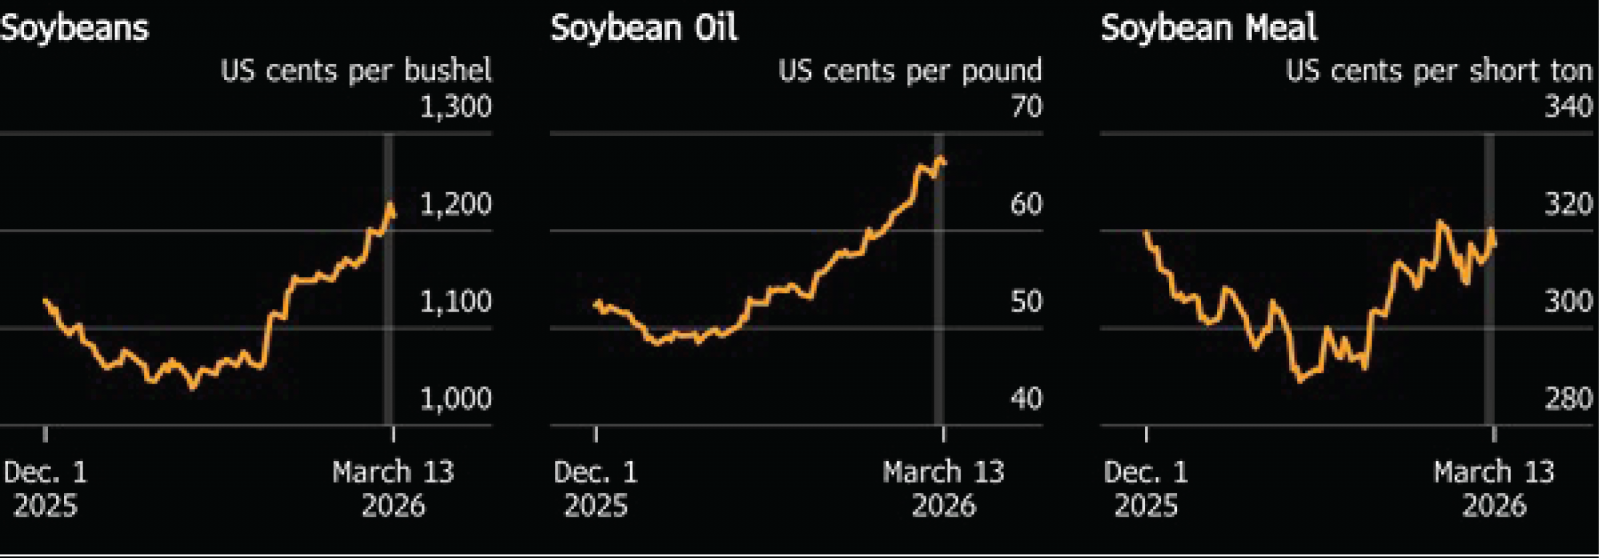
Source: Bloomberg
Corn: The Squeeze Is Building
The US produced 432 million tonnes of corn last season, a record that left ending stocks at a comfortable 54 million tonnes and prices depressed at $4.36/bushel. The expected decline to around 401 million tonnes in 2026/27 would have been manageable under normal conditions. The Iran war has changed that calculus.
The Strait of Hormuz, through which nearly half the world's urea exports flow, is effectively closed. Natural gas, the key feedstock for nitrogen fertilizer, is stranded at the source.Urea prices have spiked 30-35% in days. Critically, corn is the most nitrogen-intensive major crop, and unlike potash or phosphate, nitrogen cannot be skipped without severe yield penalties. Farmers are shifting acres to soybeans as it is less nitrogen-intensive
The demand side compoundsthe tightening Roughly 35% of US corn is consumed for ethanol production. Ethanol is blended with gasoline because it is cheaper than the petroleum component and boosts octane, reducing refinery costs while satisfying federal blend mandates. With WTI elevated on war premium, the economics widen further in ethanol's favour, incentivising blenders to push blend rates from E10 toward E15. That incremental demand is rising into a corn supply that is already contracting. Higher demand meeting lower production is the definition of a price squeeze.
Brazil, which alongside the US accounts for 75% of the global corn supply, adds a further risk. Incessant rainfall through 2025 depleted water reserves, and dryness is now spreading across southern Brazil, a region responsible for 25% of the country's output. If rainfall falls short during the critical safrinha window, the world's primary backup supply shrinks. Ukraine, at 2.3% of global supply, faces the same fertilizer cost pressure and is expected to reduce plantings.
Last year's surplus provided the cushion. This year's compounding shocks are eroding it from multiple directions simultaneously.
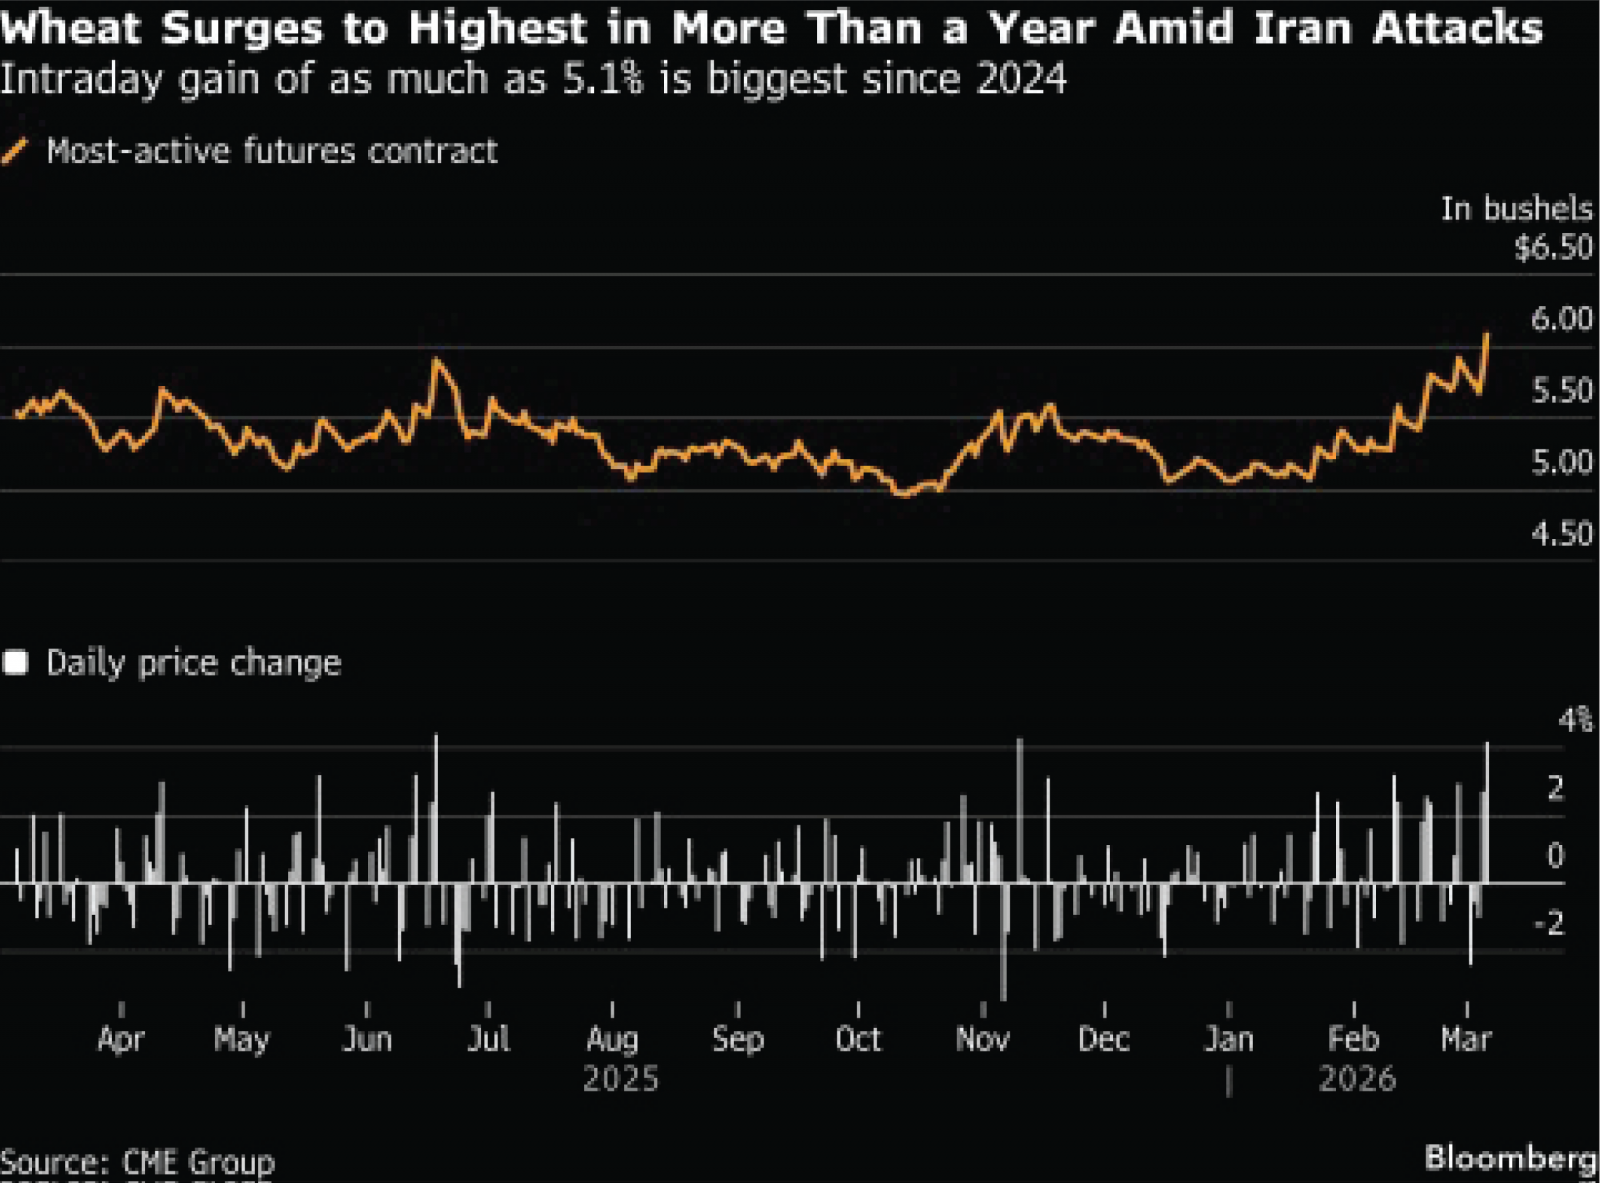
Wheat: A Defensive Play During War
Chicago wheat futures have risen as much as 5.7% since the start of the Iran-US Conflict. The move has not been driven by a shift in fundamentals; instead, wheat is being treated as a defensive agricultural commodity during periods of geopolitical tension.
It is important to note that the wheat market is currently in surplus. Global ending stocks stand at around 277 million tonnes, close to a five-year high. Despite this, prices have moved higher as security concerns have influenced market behaviour.
The closure of the Strait of Hormuz has disrupted the shipping of several key commodities. Importing countries across the Middle East, North Africa, and Southeast Asia have responded by bringing forward purchases,leading to precautionary stockpiling. This buying activity is tightening near-term availability, even though the broader supply balance remains comfortable.
Fertilizer trade has also been affected by the conflic, creating uncertainty around future corp production. As a result, farmers in regions such as the Black Sea and South Asia have accelerated purchases of key nutrients.
Market positioning has adjusted accordingly.Investment funds have moved from a net short to a net long position in wheat for the first time since 2022, reflecting a reassessment of geopolitical risk in agricultural markets.
Risks and Assumptions related to Back-tested trading strategies
Disclaimer: Century Financial Consultancy LLC (CFC) is licensed and regulated by the Capital Market Authority (CMA) of the UAE under license numbers 20200000028 and 301044 to carry out the activities of Financial Products dealer, Trading Broker in international markets, Trading Broker of OTC derivatives and currencies in the spot market, Introduction, Financial Consultations, and Promotion. CFC is incorporated under UAE law, registered with the Dubai Economic Department (No. 768189), with its office at 601, Level 6, Building No. 4, Emaar Square, Downtown Dubai, UAE, PO Box 65777.
Terms and Conditions of Access
By accessing and continuing to use the Publication (which includes this document, flyer, charts, diagrams, illustrations, images, calculations, scenario analysis, and related data or content), you confirm that you have read, understood, and agreed to the terms of this Disclaimer.
CFC reserves the right to amend or update the Publication and this Disclaimer at any time without prior notice. Continued use following any such update constitutes your acceptance of the revised terms. If you do not agree with these terms, please discontinue use of the Publication.
Purpose and Intended Use
This Publication is classified as marketing material and should not be regarded as independent investment research. It is provided for informational, educational, and illustrative purposes only and does not constitute investment advice, a recommendation, an offer, or a solicitation to buy or sell any financial instruments or services. All views expressed are general market commentary and may not reflect the opinions of CFC as a whole.
Risk Disclosures and Limitations
The information presented does not cover all the risks associated with the products or scenarios discussed. Please refer to the full Risk Disclosure Statement available on our website.
This Publication reflects information available at the time of preparation and does not account for subsequent developments. Any forward-looking statements involve assumptions and uncertainties; actual outcomes may differ materially. CFC does not guarantee the accuracy, completeness, or reliability of the information and disclaims liability for any action taken based on it.
No Offer or Contractual Commitment
No part of this Publication constitutes an offer, agreement, or commitment to enter into any transaction. Distribution of this Publication does not oblige CFC to engage in any trade or provide any services. Product names or terms may differ across platforms or providers. This material should not be interpreted as legal, regulatory, tax, accounting, or credit advice. Recipients should seek independent professional advice and assess their own financial situation, objectives, and risk profile before making investment decisions.
Data Sources and Interpretation
This Publication may rely on publicly available data, third-party information, or model-based assumptions. CFC makes no representation or warranty as to their accuracy or completeness. Data limitations, errors, or outdated inputs may impact the reliability of projections or scenarios. Names of financial products may differ from those used on trading platforms.
Use, Reproduction, and Analyst Disclosure
This Publication is intended solely for the recipient’s informational use. It may not be copied, transmitted, or distributed in any form, wholly or partially, without prior written permission from CFC.
Analyst Declaration: The Analyst(s) certifies that all opinions expressed in this Publication represent their own independent views and that reasonable care was taken to ensure objectivity. They do not hold securities in the companies mentioned, and their compensation is not linked to the views expressed. CFC’s research and marketing divisions operate independently.
Trading Risk Warning:
Trading in financial products involves significant risk. Leveraged OTC derivatives, such as Contracts for Difference (CFDs) and spot forex contracts, carry a high risk of loss that can potentially exceed initial deposits and may not be suitable for all investors. These instruments do not confer ownership of underlying assets. Investors must carefully evaluate their investment objectives and risk tolerance, and consult independent advisors where appropriate.


Regulated by CMA
Century Financial Consultancy LLC


.png)
.png)
.png)
.png)
.png)

Reach us:
-
Dubai
6th Floor, Emaar Square Building 4,
Downtown, Dubai, P.O. Box 65777,
Dubai, United Arab Emirates -
Abu Dhabi
27th Floor, Office 2701,
Shining Towers, Abu Dhabi, UAE -
Sharjah
29th Floor, Office 2905,
The Business Tower, Sharjah, UAE - +971 (4) 356 2800
- info@century.ae

Disclaimer: Trading in financial products carries substantial risk. Leveraged over-the-counter (OTC) derivatives, such as Contracts for Difference (CFDs) and spot forex, may result in losses exceeding initial deposits and may not be suitable for all investors. These complex instruments do not confer ownership of the underlying assets. Investors should carefully consider their investment objectives and risk appetite, and seek independent professional advice if necessary.
Century Financial Consultancy LLC (CFC) is licensed and regulated by the Capital Market Authority (CMA) of the UAE under license numbers 20200000028 and 301044 to carry out the activities of Financial Products dealer, Trading Broker in international markets, Trading Broker of OTC derivatives and currencies in the spot market, Introduction, Financial Consultations, and Promotion. CFC is incorporated under UAE law, registered with the Dubai Economic Department (No. 768189), with its office at 601, Level 6, Building No. 4, Emaar Square, Downtown Dubai, UAE, PO Box 65777.
The content on this website is provided solely for informational and educational purposes and does not constitute an offer, recommendation, or solicitation to buy or sell any securities or financial products.
Products and services offered by CFC are not intended for use in any jurisdiction where such use or distribution would breach local laws or regulatory requirements.
⚠️ Alert: Fraudulent Activity Notice
Century Financial Consultancy LLC (“Century”) has become aware of fraudulent individuals and entities impersonating our firm through unofficial websites, social media channels, and messaging applications such as Telegram, WhatsApp, and Discord.
Please be advised:
- Century does not manage investments on behalf of clients.
- Century does not solicit funds or guarantee investment returns.
- Century does not accept or make payments in cash, cryptocurrency, or digital assets.
- We do not conduct business via social media or messaging platforms.
Our only official website is www.century.ae, and all communication is conducted exclusively through verified channels.
We strongly urge the public to remain vigilant, verify the authenticity of any communication claiming to be from Century, and report any suspicious activity. Century disclaims any responsibility for losses arising from dealings with unauthorised or fraudulent parties.
