 Loading ...

Monday, August 31, 2026
Digital Assets and Crypto: Macros Turns Supportive
تم إعداد هذا المنشور من قبل سنشري للاستشارات
.jpg)
Bitcoin surged nearly 24% last week, its strongest weekly gain since March 2023, as macro, policy and market structure aligned in a rare tailwind for digital assets. Secretary Bessent said the Treasury would at least double the size of long-dated buybacks, funded through greater short-dated bill issuance. Markets read this as a step that may reduce the volume of duration the market must absorb, with potential moderating effects on long-end yields, term premium, and real-yield expectations. If sustained, this softens the marginal carry appeal of the US dollar and improves the relative backdrop for finite-supply and non-sovereign assets like cryptocurrencies. President Trump's meeting with representatives from Coinbase Global Inc. and Payward Inc. was interpreted as reinforcing the administration's constructive stance. The president urged Senate passage of the Clarity Act, a market-structure bill that did not reach a vote before the August recess. Sustained executive engagement can improve institutional confidence even without enacted legislation. Over $2 billion in bearish Bitcoin positions have been liquidated, spot ETFs are running for their biggest weekly inflows since January, and the long-term-holder share of supply is the highest since December 2023.
Exhibit 1 — Macro-to-crypto transmission mechanism (market-interpreted)
Treasury long-
dated
buybacks /
short-bill
issuance
reduction in net
duration of
government
debt
moderation in
long-end
yields,
particularly real
yields
dollar-carry
appeal /
improved
scarcity-asset
backdrop
institutional
demand for
cryptos,
amplified by
ETF flows &
short covering
Bitcoin — Primary institutional expression
Bitcoin remains the primary institutional expression of the thesis: a finite-supply, non-sovereign digital monetary asset that may attract demand when investors seek alternatives to fiat-currency debasement risk or falling real-yield environments. Institutional access through US-listed spot ETF continues to deepen the buyer base, with this week's inflows and short-covering providing near-term positioning support. Large token holders, known as Bitcoin whales, recently added roughly $2.75 billion worth of the token in 60 days, according to CryptoQuant.
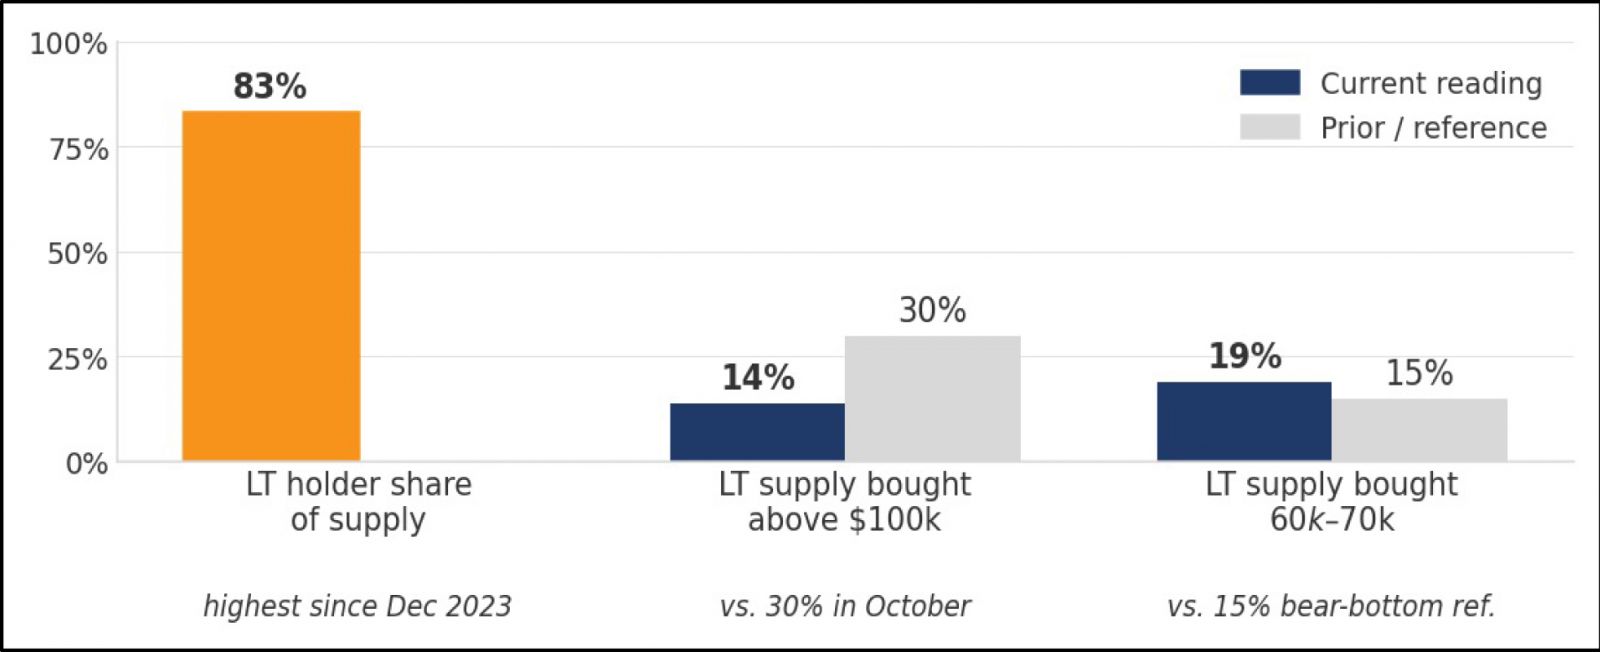
Ownership composition reinforces the setup: long-term holders now control 83% of supply, the highest share since December 2023. Only 14% of long-term supply was acquired above $100,000, versus 30% in October, while 19% was acquired between $60,000–$70,000 — above the 15% level historically associated with bear-market-bottom conditions. Fewer holders sit on vulnerable high-cost bases, lowering forced-selling pressure. Ownership concentration and cost-basis composition do not guarantee future gains.
Exhibit 2 — Bitcoin's weekly net flows
.jpg)
Exhibit 3 — Bitcoin's ownership base appears more resilient
Technicals (Bitcoin)
(1).jpg)
Bitcoin’s recent rally has pushed it above both the descending 50-day SMA (black line) and the 200-day SMA (blue line), reinforcing the bullish setup. Resistance stands around $83,000, while support is seen at $69,000 (200-day SMA), followed by $67,500, the triangle breakout zone.
Ethereum — Differentiated Infrastructure Exposure
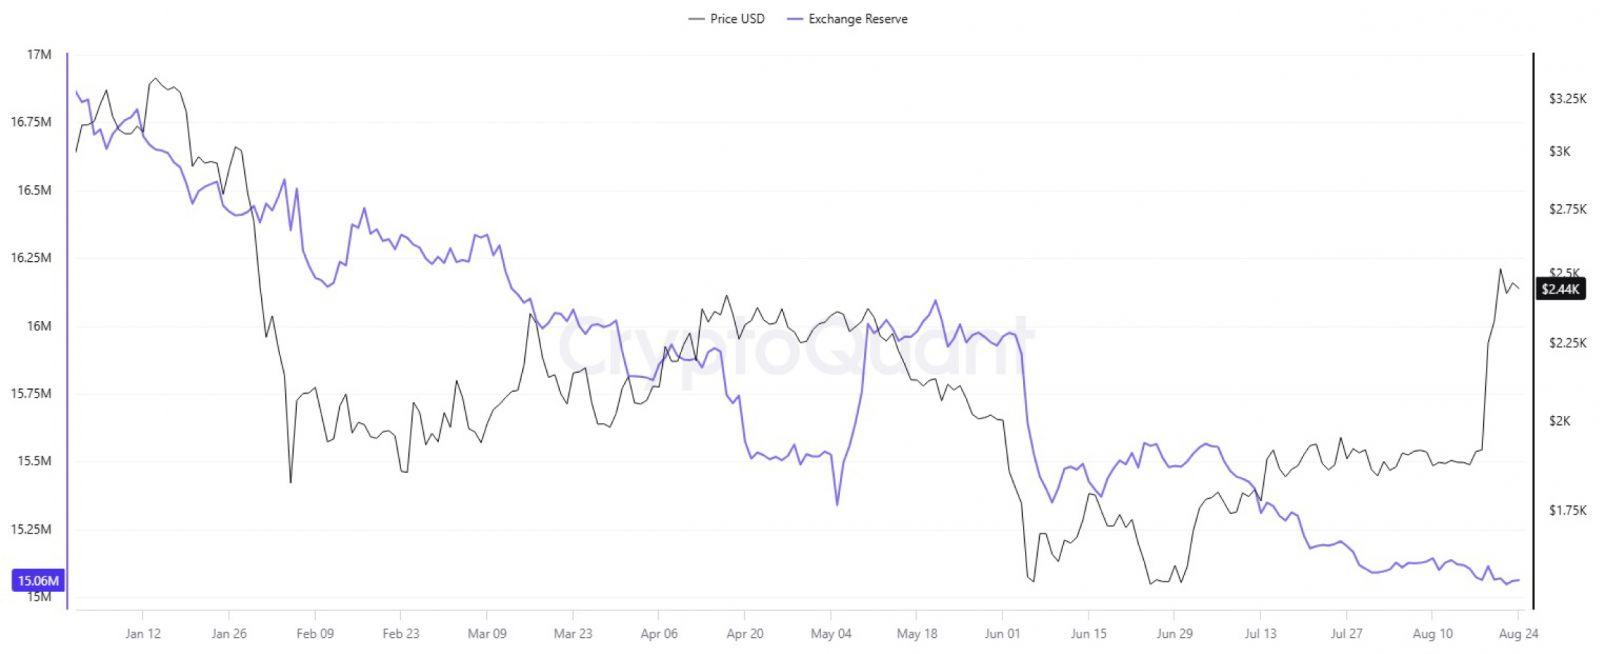
Ethereum offers a differentiated exposure through its role in smart-contract settlement, stablecoin issuance, and tokenised-finance infrastructure. The coin surged 31% over the past week, reaching a high of $2,546 fueled by strong inflows into Ethereum ETFs, short covering, and reduced exchange supply. Spot ETFs attracted nearly $700 million in net inflows, with major players like BlackRock leading demand. The rally was supported by shrinking ETH supply on exchanges and increased futures activity. Exchange Reserve tracks the total amount of a crypto asset held across exchange wallets at any given time and serves as one of the most direct on-chain indicators of available sell-side supply on the market. After a surge in May and June, a sustained decline signals coins moving to self-custody, reducing available supply and reflecting longer-term holding behaviour.
Exhibit 4 — Ethereum Exchange Reserve
.jpg)
Ethereum also showed similar price action to Bitcoin, recovering its 50-day SMA (black line) and 200-day SMA (blue line), suggesting bulls are now in control. Resistance stands around $2,800, while support is seen at $2,010 (200-day SMA), followed by $1,815.
Stocks Snapshot
| Name | Sector | Ticker | 52 Week Low ($) |
*Last Price ($) |
52 Week High ($) |
Market Capitalization ($ Billion) |
Total Analyst Recommendations | Analyst Target Price ($) |
Potential Price Appreciation (%) |
||
|---|---|---|---|---|---|---|---|---|---|---|---|
| Buy | Hold | Sell | |||||||||
| Coinbase Global Inc | Capital Markets | COIN | 139.11 | 179.48 | 402.16 | 47.35 | 27 | 9 | 5 | 196.59 | 10% |
| Galaxy Digital Inc | Capital Markets | GLXY | 16.43 | 22.84 | 45.92 | 8.93 | 14 | 2 | 0 | 39.75 | 74% |
| Circle Internet Group Inc | Software | CRCL | 49.9 | 87.72 | 159.47 | 22.27 | 17 | 12 | 4 | 101.24 | 15% |
| Strategy Inc | Software | MSTR | 81.81 | 122.63 | 365.21 | 47.12 | 18 | 3 | 1 | 230.44 | 88% |
Data as of close of 24th August 2026
Coinbase (COIN)
Coinbase is a global digital asset platform that provides retail trading, institutional prime brokerage, cold-storage custody, and decentralized blockchain infrastructure through its proprietary Base network. In the second quarter, net revenue declined 19% year over year as softer market sentiment and lower token prices pushed spot trading volume down 24%. Net income reflected a GAAP loss primarily driven by $210 million in unrealized pretax crypto mark-to-market losses, though adjusted EBITDA remained positive at $208 million for its 14th consecutive quarter.
Lower Treasury yields and a weaker dollar inject global liquidity into financial markets, driving capital out on the risk curve into Bitcoin and digital assets. On a company level, this macro shift directly accelerates Coinbase’s high-margin trading fee revenue as retail and institutional volumes rebound. Rising asset valuations simultaneously increase custodial fee income across spot Bitcoin and Ethereum ETFs, where Coinbase serves as the dominant vault provider. Furthermore, broader market liquidity fuels user adoption on Base, Coinbase’s Ethereum Layer-2 network that captures 71% of Layer-2 transactions and is expected to generate $140 million in fee revenue this year.
Galaxy Digital (GLXY)
Galaxy Digital is a diversified digital asset platform spanning institutional crypto trading, lending, prime brokerage, staking, tokenization, and investment banking through its Global Markets business, alongside AI/HPC data center capacity via its Helios campus. Second-quarter revenue of $8.6 billion missed consensus of $9.2 billion and adjusted EBITDA showed a $77 million loss, though this understates the franchise's resilience: Digital Assets posted $66 million in adjusted gross profit, trading volume fell just 7% against the industry's ~20% drop, and assets under stake reached $2.8 billion. The recent macro-driven crypto rally with Bitcoin up ~24% and Ethereum ~31% in a single week, alongside record spot ETF inflows and heavy short covering after Treasury buyback expansion softened long-end yields and the dollar directly lifts Galaxy's trading fee run-rate, staking yield, asset management AUM, and the mark-to-market on its $1.2 billion on-balance-sheet crypto and venture book. Three crypto-native tailwinds compound the setup: institutional migration onto blockchain rails scales Galaxy's integrated platform across custody, staking, and tokenization, with anchor partners including Invesco, State Street, and Morgan Stanley; deepening spot Bitcoin and Ethereum ETF flows extend the institutional allocation runway; and the Helios CoreWeave lease anchors ~$1.2 billion in average annual revenue at ~90% lease-level EBITDA margins.
Circle (CRCL)
Circle Internet Group operates the primary infrastructure for digital dollar payments, serving as the offcial issuer of USDC and EURC stablecoins. Beyond stablecoin issuance, the company is evolving into a full-stack financial platform providing global liquidity, cross-border settlement through Circle Payments Network (CPN), Cross-Chain Transfer Protocol (CCTP), and institutional blockchain infrastructure via its proprietary Arc network.
In the second quarter of 2026, total revenue reached $701 million, a 7% YoY increase. Revenue was driven by $668 million in reserve income as average USDC in circulation climbed 25% year over year to an all-time high of $76.5 billion. Second quarter adjusted EPS was $0.18, beating consensus estimates, while net income totalled $48 million.
Circle's primary earnings engine is the high-margin interest income generated by the short-term US Treasuries backing its massive USDC reserve. Even with recent rate suppression, Treasury yields remain historically elevated, providing a steady, highly profitable baseline of cash flow. Simultaneously, this easing liquidity environment has ignited strong bullish sentiment across Bitcoin and the broader cryptocurrency market, accelerating trading velocity and driving USDC circulation to record levels. This powerful combination of robust Treasury yields and surging digital asset adoption is further amplified by Circle's regulatory dominance under the GENIUS Act and the impending institutional launch of its Arc network, positioning the firm to capture massive upside in the expanding digital economy.
High Risk Stock
(DATCO)
Strategy (MSTR)
Strategy has transformed from a small enterprise software provider into the world's leading Bitcoin Treasury company, guided by Executive Chairman Michael Saylor. It is the first and largest bitcoin treasury firm. Strategy’s Q2 2026 revenue rose by 7% yoy to $122.4 million with a gross profit of $81.6 million, representing a 66.6% gross margin. It reported a second-quarter operating loss of $8.3 billion and a net loss of $8.6 billion, driven mainly by a non-cash bitcoin mark-to-market charge. However, the BTC yield was 5% QoQ and 11% YoY, while BTC gains reached 30,000 BTC year-to-date, representing roughly 30% of last year’s full-year gain. Despite the significant YoY drawdown in BTC price, management still expects positive performance across its key KPIs, supported by the potential to return STRC to par, lower the STRC rate below 12%, use buybacks when the security trades at a discount, and further monetise BTC.
Lower long-term Treasury yields and a softening US dollar inject fresh liquidity into global markets, driving capital into alternative assets and strengthening Bitcoin's store-of-value appeal. On a company level, declining yields lower the cost of capital, allowing Strategy to issue preferred digital credit, such as its 12% STRC preferred shares, to aggressively fund accretive Bitcoin purchases. Moreover, Strategy controls roughly 4% of Bitcoin's total 21 million supply.
Available ETFs for Exposure to Cryptocurrencies
| Name | iShares Bitcoin Trust ETF | iShares Ethereum Trust ETF |
|---|---|---|
| Ticker | IBIT US EQUITY | ETHA US EQUITY |
| Inception Date | 11/01/2024 | 23/07/2024 |
| 52W High ($) | 71.82 | 36.04 |
| Last Price* ($) | 43.68 | 18.24 |
| 52W Low ($) | 32.84 | 11.52 |
| Total Assets (In $ Millions) | 59,014.49 | 7835.17 |
| NAV ($) | 43.66 | 18.21 |
| Expense Ratio (%) | 0.25 | 0.25 |
| ISIN | US46438F1012 | US46438R1059 |
| Dividend Indicated Yield (12M %) | - | - |
| Dividend Frequency | - | - |
Risks and Assumptions related to Back-tested trading strategies
Disclaimer:Century Financial Consultancy LLC (CFC) is licensed and regulated by the Capital Market Authority (CMA) of the UAE under license numbers 20200000028 and 301044 to carry out the activities of Financial Products dealer, Trading Broker in international markets, Trading Broker of OTC derivatives and currencies in the spot market, Introduction, Financial Consultations, and Promotion. CFC is incorporated under UAE law, registered with the Dubai Economic Department (No. 768189), with its office at 601, Level 6, Building No. 4, Emaar Square, Downtown Dubai, UAE, PO Box 65777.
Terms and Conditions of Access
By accessing and continuing to use the Publication (which includes this document, flyer, charts, diagrams, illustrations, images, calculations, scenario analysis, and related data or content), you confirm that you have read, understood, and agreed to the terms of this Disclaimer.
CFC reserves the right to amend or update the Publication and this Disclaimer at any time without prior notice. Continued use following any such update constitutes your acceptance of the revised terms. If you do not agree with these terms, please discontinue use of the Publication.
Purpose and Intended Use
This Publication is classified as marketing material and should not be regarded as independent investment research. It is provided for informational, educational, and illustrative purposes only and does not constitute investment advice, a recommendation, an offer, or a solicitation to buy or sell any financial instruments or services. All views expressed are general market commentary and may not reflect the opinions of CFC as a whole.
Risk Disclosures and Limitations
The information presented does not cover all the risks associated with the products or scenarios discussed. Please refer to the full Risk Disclosure Statement available on our website.
This Publication reflects information available at the time of preparation and does not account for subsequent developments. Any forward-looking statements involve assumptions and uncertainties; actual outcomes may differ materially. CFC does not guarantee the accuracy, completeness, or reliability of the information and disclaims liability for any action taken based on it.
No Offer or Contractual Commitment
No part of this Publication constitutes an offer, agreement, or commitment to enter into any transaction. Distribution of this Publication does not oblige CFC to engage in any trade or provide any services. Product names or terms may differ across platforms or providers. This material should not be interpreted as legal, regulatory, tax, accounting, or credit advice. Recipients should seek independent professional advice and assess their own financial situation, objectives, and risk profile before making investment decisions.
Data Sources and Interpretation
This Publication may rely on publicly available data, third-party information, or model-based assumptions. CFC makes no representation or warranty as to their accuracy or completeness. Data limitations, errors, or outdated inputs may impact the reliability of projections or scenarios. Names of financial products may differ from those used on trading platforms.
Use, Reproduction, and Analyst Disclosure
This Publication is intended solely for the recipient’s informational use. It may not be copied, transmitted, or distributed in any form, wholly or partially, without prior written permission from CFC.
Analyst Declaration: The Analyst(s) certifies that all opinions expressed in this Publication represent their own independent views and that reasonable care was taken to ensure objectivity. They do not hold securities in the companies mentioned, and their compensation is not linked to the views expressed. CFC’s research and marketing divisions operate independently.
Trading Risk Warning:
Trading in financial products involves significant risk. Leveraged OTC derivatives, such as Contracts for Difference (CFDs) and spot forex contracts, carry a high risk of loss that can potentially exceed initial deposits and may not be suitable for all investors. These instruments do not confer ownership of underlying assets. Investors must carefully evaluate their investment objectives and risk tolerance, and consult independent advisors where appropriate.
__706859886.jpg)





تنظمها هيئة الأوراق المالية والسلع
سنشري للاستشارات المالي ش.ذ.م.م


تصل إلينا:
-
دبي
الطابق رقم 6, مبنى رقم 4, ساحة إعمار دبي
وسط مدينة دبي، ص.ب: 65777،
دبي، الإمارات العربية المتحدة -
Abu Dhabi
27th Floor, Office 2701,
Shining Towers, Abu Dhabi, UAE -
Sharjah
29th Floor, Office 2905,
The Business Tower, Sharjah, UAE - +971 (4) 356 2800
- info@century.ae

Century Financial is the presenting sponsor of

ينطوي التداول في المنتجات المالية على مخاطر كبيرة. فالاعتماد على المشتقات المالية المتاحة للتداول خارح البورصة، مثل عقود الفروقات وتداول العملات الأجنبية (الفوركس) الفوري، قد يتسبب في خسائر تتجاوز قيمة الإيداعات الأولية، مما يجعلها غير ملائمة لجميع المستثمرين. فهذه الأدوات المالية المعقدة لا تمنح ملكية مباشرة للأصول الأساسية. لذا، ينبغي للمستثمرين الاحتراز عند تحديد أهدافهم الاستثمارية ومراعاة مستوى المخاطرة المتوقَع، واللجوء إلى الاستشارة المهنية المتخصصة عند الضرورة.
سنشري للإستشارات والتحليل المالي ش.ذ.م.م (الشركة)، شركة مرخّصة ومنظمة من هيئة الأوراق المالية والسلع في دولة الإمارات العربية المتحدة، بموجب الترخيص رقم (20200000028) و(301044) لتولي أعمال الوساطة في الأسواق الدولية، وتداول المشتقات المالية والعملات المتاحة للتداول خارج البورصة في سوق التداول الفوري، بالإضافة إلى تقديم الخدمات الاستشارية والترويجية. تأسست الشركة بموجب قوانين دولة الإمارات العربية المتحدة، وهي مسجلة لدى دائرة التنمية الاقتصادية بدبي (رقم: 768189)، حيث يقع مكتبها المسجّل في 601، الطابق السادس، المبنى رقم 4، ميدان إعمار، وسط مدينة دبي، دولة الإمارات العربية المتحدة، ص.ب. 65777.
لا يُعرَض محتوى هذا الموقع الإلكتروني إلا لأغراض تعريفية تثقيفية بحتة، فلا يمثل عرضًا ولا توصيةً ولا دعوةً لشراء أو بيع أي أوراق مالية أو منتجات مالية.
لا تنوي الشركة استخدام أو توزيع منتجاتها وخدماتها في أي ولاية قضائية حيث يُشكِّل هذا الاستخدام أو التوزيع انتهاكًا للقوانين المحلية أو اللوائح التنظيمية.
