 Loading ...

Tuesday, September 01, 2026
Harvesting Opportunities in Agro Commodities : Navigating El Niño and Dollar Cycles
تم إعداد هذا المنشور من قبل سنشري للاستشارات
.jpg)
Agricultural Commodities Outlook
How a strengthening El Niño and a weaker dollar are reshaping cocoa, sugar, soybeans, corn & wheat
event
dollar-priced grains
El Niño
El Niño is a climate pattern where the central and eastern Pacific Ocean warms, shifting rainfall, temperature, and storm patterns worldwide.
El Niño conditions are strengthening in August, with equatorial sea surface temperatures above average in the east-central Pacific Ocean, according to NOAA's Climate Prediction Center. This is likely to create a strong El Niño across fall and winter in the Northern Hemisphere and persist through April 2027 at least. By August–October, the probability of strong or very-strong is nearly 100%, climbing further by October–December. El Niño conditions in 2023–24 were the strongest stretch since 2016.
WHY IT MATTERS
The last comparable event, in 2023·24, helped triple global cocoa prices and cut corn yields by 10·20%. With a greater-than-90% chance of a "very strong" repeat this cycle, weather is once again the single biggest swing factor across the soft commodities complex.
Dollar Weakness
Agro commodities are priced and traded globally in dollars — a softer greenback from Bessent's Treasury buyback expansion and falling yields effectively lowers the cost of these grains for buyers holding euros, yen, or other currencies, which can boost demand when Black Sea supply disruptions are already tightening availability.
The same dynamic that has pushed investors toward gold and the Swiss franc as hedges against dollar debasement can extend to agricultural commodities as well, as some investors apply similar hard-asset, store-of-value logic to food commodities when confidence in fiat currency erodes — though the evidence for this specific spillover into ag futures is thinner than the well-documented flows into gold. Evidence that foreign central banks are trimming Treasury holdings in favor of gold reserves points to a broader diversification trend that could extend to agricultural futures.
A weaker dollar cuts the other way for producers outside the US: because fertilizer and fuel are also priced in dollars, the same currency effect that lowers grain costs for foreign buyers also lowers those input costs in local-currency terms — supporting farm margins abroad rather than squeezing them.
THE TAKEAWAY
If policymakers continue leaning on interventionist measures rather than fiscal discipline, the resulting downside pressure on the Dollar Index should keep reinforcing upward price momentum in wheat, corn, and soybeans · on top of the supply-driven gains already underway from the Ukraine export crisis.
Cocoa
SUPPLY
Cocoa production is highly concentrated — Ivory Coast and Ghana together account for the bulk of world supply, making their weather the single biggest driver of the market. During the last El Niño in 2023–24, West Africa's weather turned damaging in two stages: unusually heavy rainfall triggered black pod disease, then peak-event heatwaves and drought desiccated surviving pods — conditions that helped triple global prices. NOAA has now issued an El Niño Advisory, and farmers are again reporting heavier-than-usual rain.
DEMAND
Global grindings rose 9.95% YoY to 811,671 tonnes. Asian Q2 grindings jumped 25% to 224,646 tonnes, and North American Q2 grindings rose 7.7% to 109,659 tonnes, reversing a forecast contraction. Western Europe was the one soft spot, down 4.6% to 316,366 tonnes.
INVENTORIES & SEASONALITY
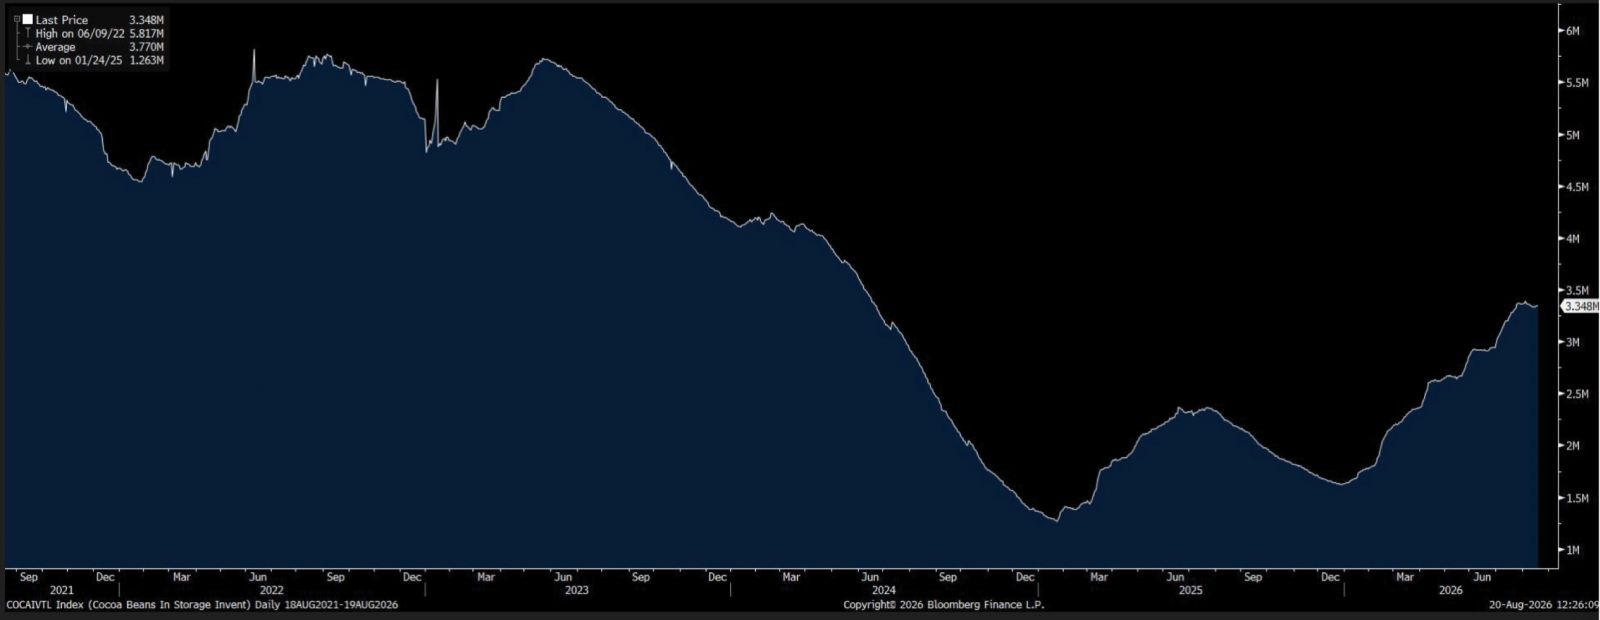
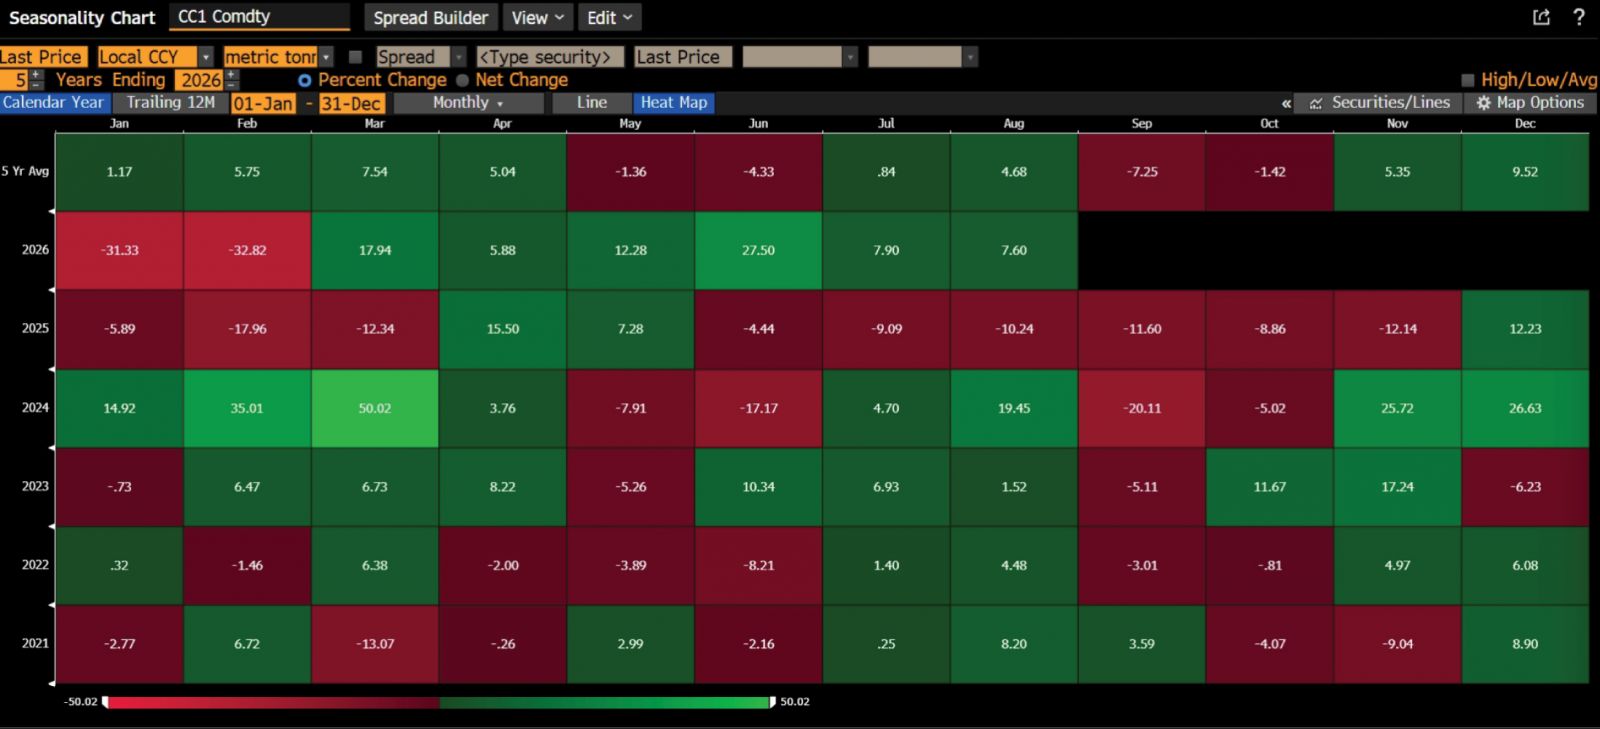
Inventories sit at a two-year high of 3.348 million bags — superficially bearish, but stocks were similarly high in 2022 just before the 2023–24 El Niño hit and the market swung into acute deficit. StoneX has narrowed its 2026–27 global surplus forecast to just 25,000 tonnes, down from 149,000. September and October are historically the weakest months as harvest floods the market, but a short crop could flip that pattern into sharp November upside.
THE SETUP
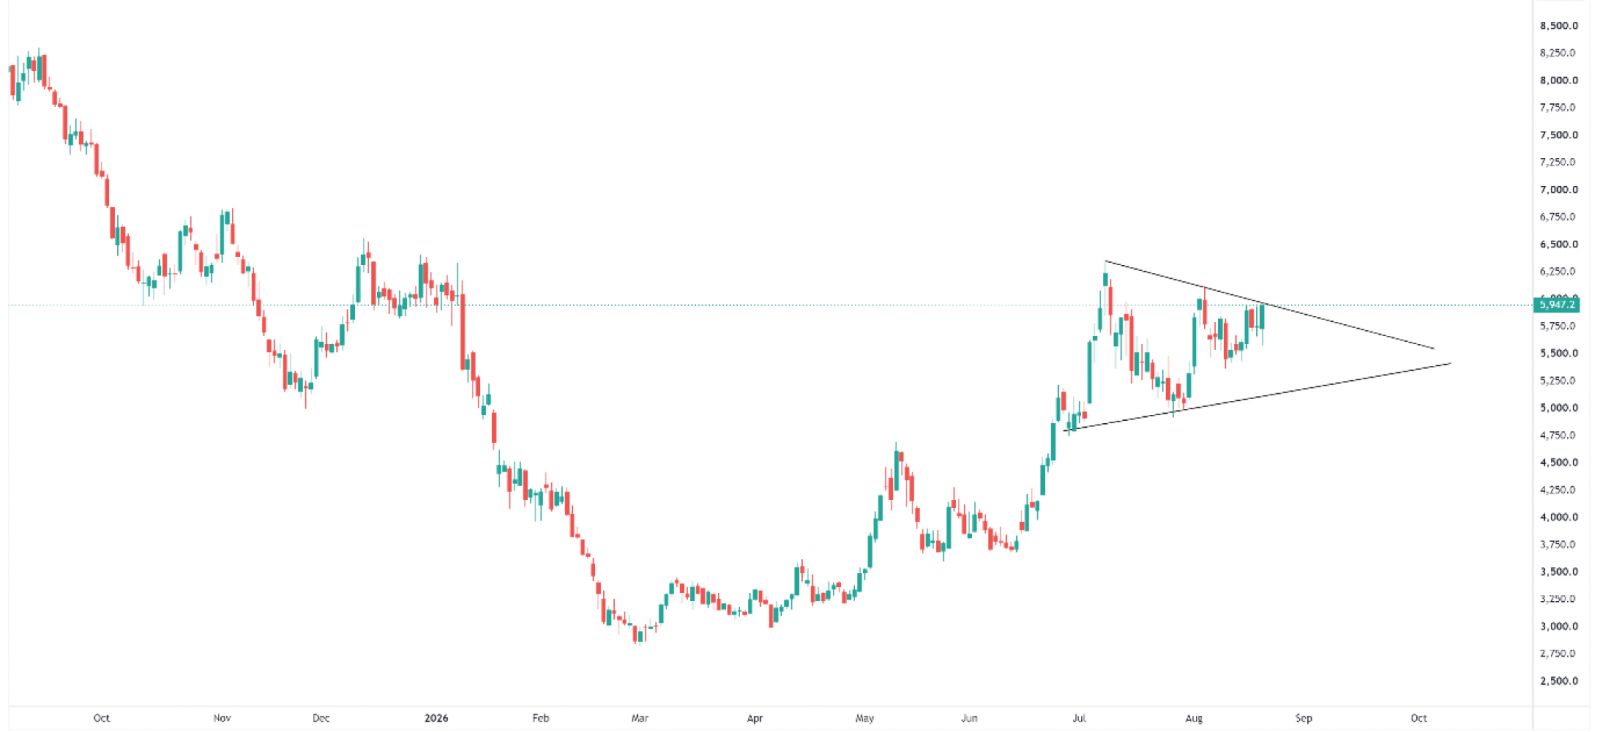
On the charts, cocoa is consolidating inside a symmetrical triangle, with around $5,121 the key downside level to watch. A break higher would be bullish.
White Sugar
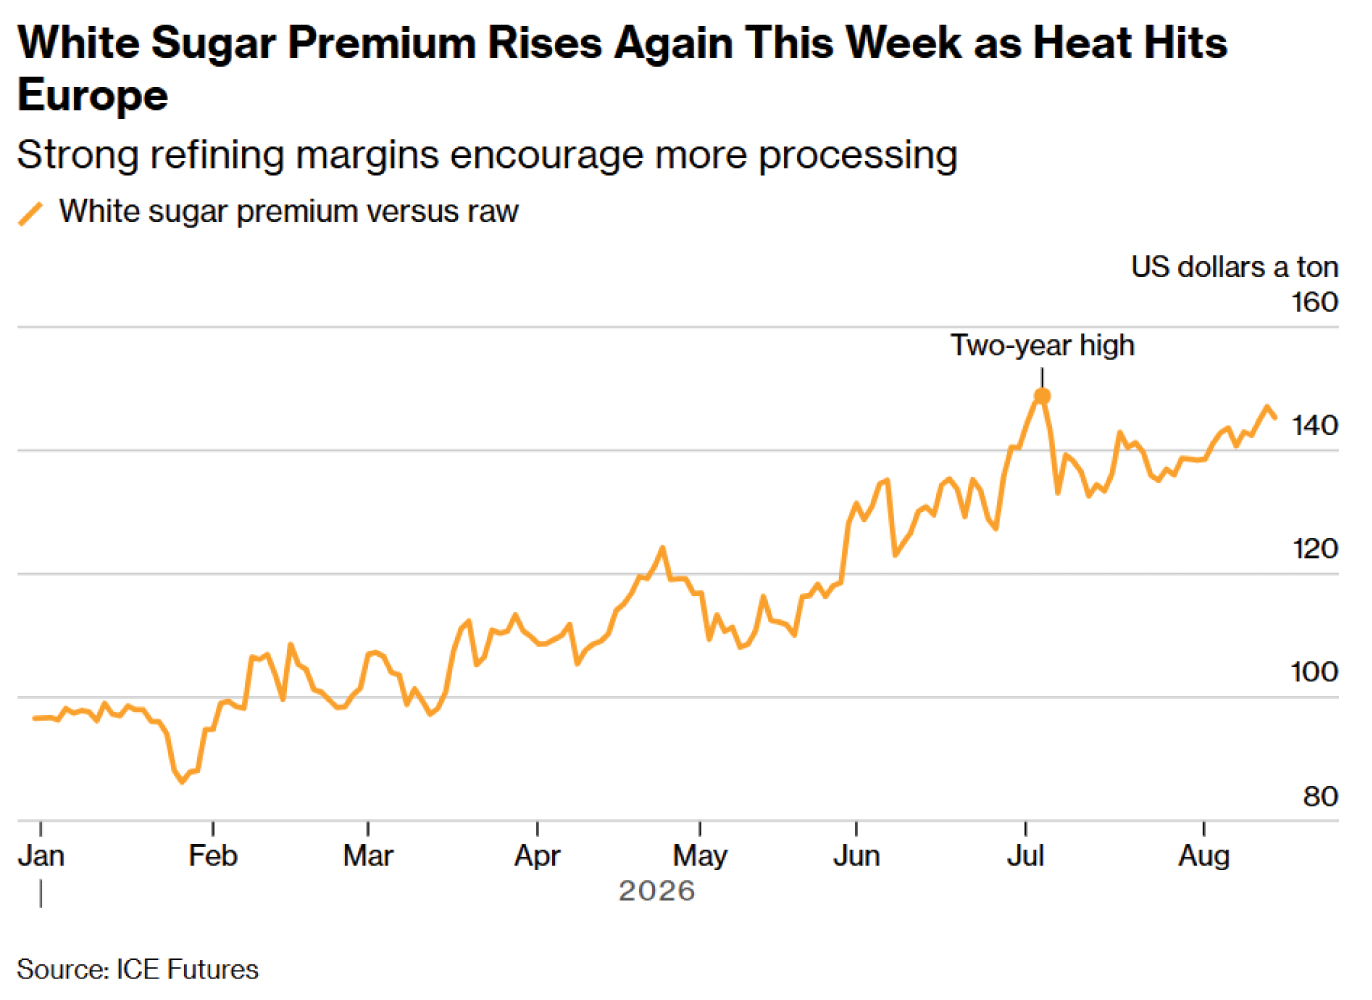
White Sugar has emerged as one of the strongest-performing soft commodities in August, rallying more than 17% as of August 20, 2026. London futures have advanced for three consecutive weeks, pushing the white-sugar premium over raw sugar back toward elevated levels — a sign of firm demand for refined sugar relative to more abundant raw supplies.
SUPPLY BALANCE
Analysts now forecast global production of 178.5 million tonnes versus consumption of 179 million tonnes, implying a roughly 600,000-tonne deficit; other estimates point to deficits as wide as 1.7–3.3 million tonnes. The 2027–28 forecast deficit widens further to 2.9 million tonnes.
WEATHER & POSITIONING
A strengthening El Niño with >90% probability of becoming very strong threatens drier conditions in India and Thailand, while excessive rainfall could disrupt Brazilian harvesting. Indian domestic prices have risen to record levels, prompting stockholding restrictions and possible duty-free imports. Hedge funds recently reached record bullish exposure to white sugar.
THE TAKEAWAY
Tightening global balances, European crop stress, El Niño risk, Indian supply pressure, and increasingly bullish positioning continue to favour White Sugar on a medium-term basis.
Soybean
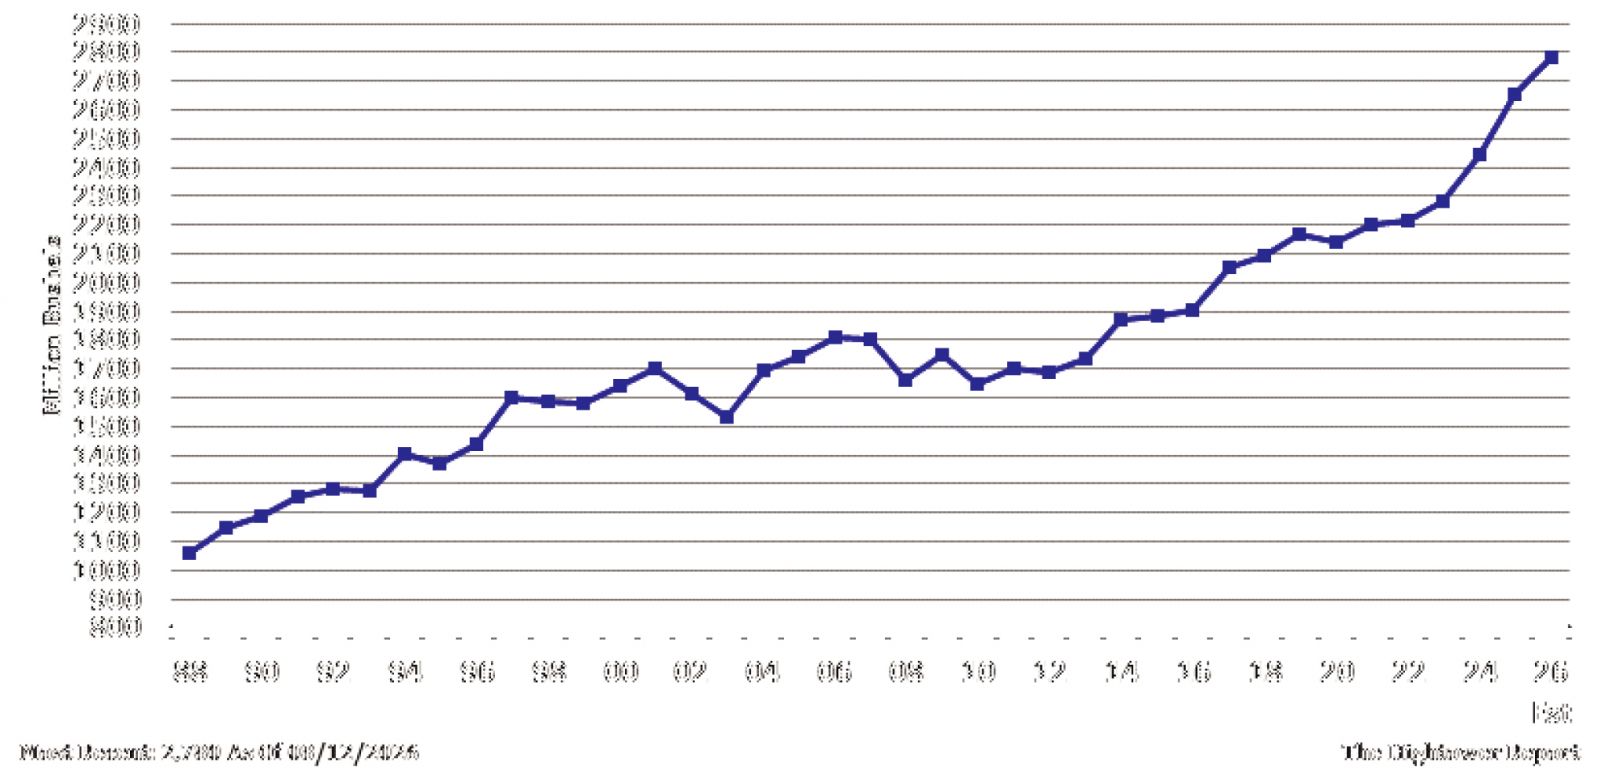
Soybeans are supported by strong domestic demand, tightening global inventories, rising energy prices, and improving export prospects. The USDA's August 2026 report projects global ending stocks at 124.21 million tonnes, down from 125.12 million in July, with stocks-to-use falling to 28.1% from 32.3%.
DEMAND DRIVERS
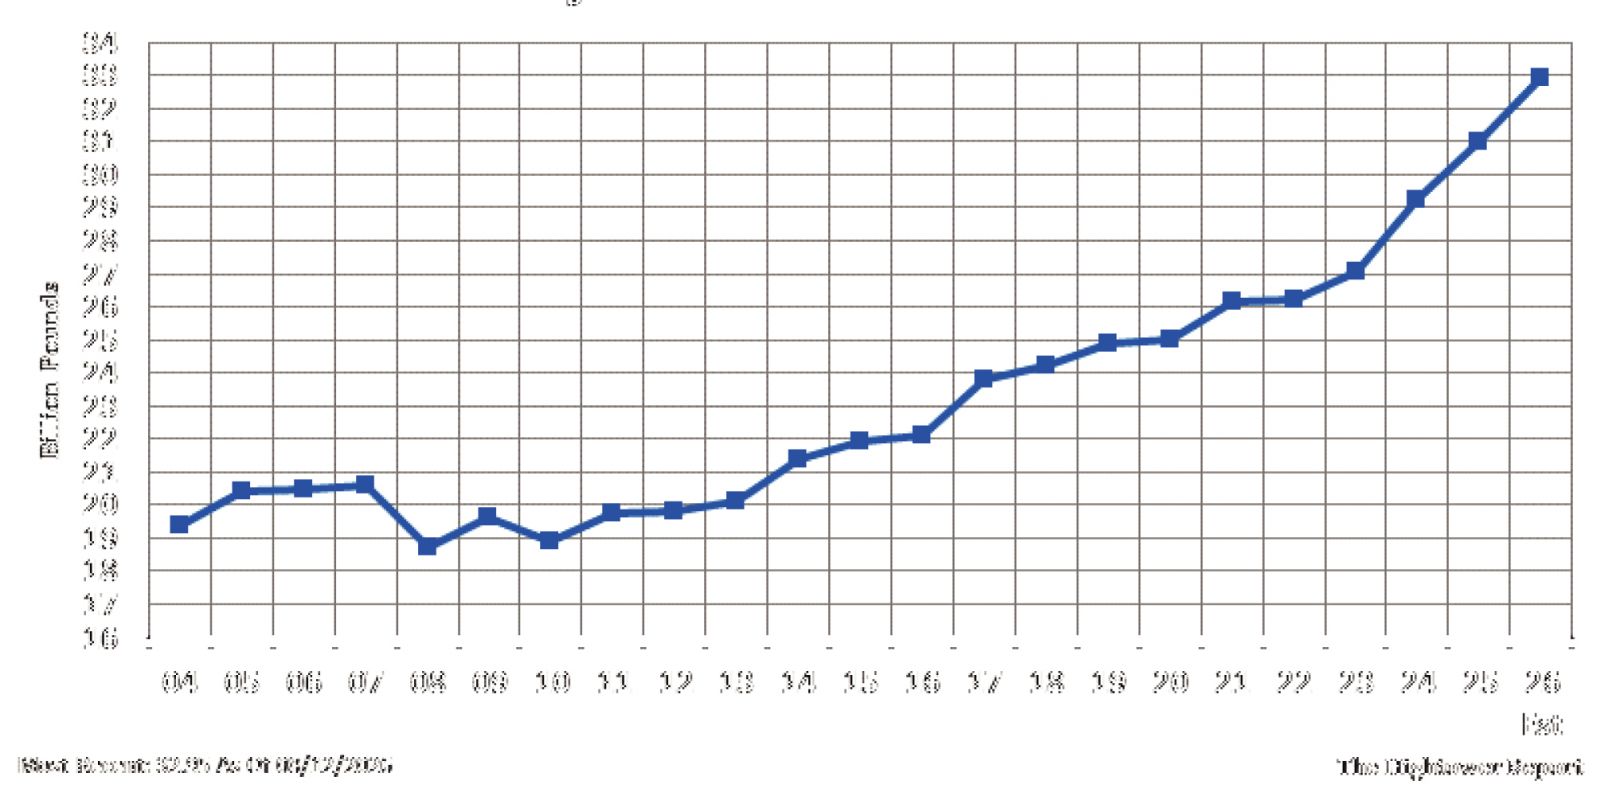
US crushing capacity continues expanding to meet rising soybean oil demand for renewable diesel and biofuels, with crush plants running at the highest utilization levels. The West Asia conflict has disrupted oil flows through the Strait of Hormuz — a route handling roughly 20% of global crude and LNG shipments — lifting crude prices and improving renewable diesel economics. China added a fresh catalyst, confirming purchases of nearly 500,000 tonnes of US soybeans in early August, with traders reporting total buying near 1 million tonnes.
THE TAKEAWAY
Falling global inventories, strong crushing demand, higher crude oil prices, and renewed Chinese buying are creating a favourable backdrop for soybean prices.
Corn
SUPPLY SHOCK
El Niño this year is on track to become the most powerful in 76 years. Brazil accounts for almost 10% of global corn production, and its safrinha crop in Central Brazil is highly rainfall-dependent and planted on a tight schedule after soybeans — making it acutely vulnerable to El Niño-driven drought. A UN report found comparable 2023–24 heat and drought cut corn yields 10–20%. Meanwhile, Pro Farmer Crop Tour data puts Illinois's yield at 184.2 bu/acre, down from 199.6 last year, France is predicting its smallest harvest since 1980, and Black Sea conflict is slowing Ukrainian exports.
DEMAND CATALYST
Rising oil prices have lifted ethanol demand. USDA maintains its estimate of 5.6 billion bushels of corn going to ethanol in 2026–27, up from 5.55 billion the prior year. US ethanol producers consumed 472 million bushels of corn in May 2026 alone, up sharply versus both the prior month and May 2025.
THE TAKEAWAY
Taken together, tightening supply and increasing biofuel demand create a favourable backdrop, skewing corn prices towards a bullish bias.
Wheat
Global wheat production for 2026–27 is forecast at 819.1 MMT, down roughly 24.7 MMT from 843.8 MMT the prior year. Global ending stocks are expected to fall to about 275 MMT, while major exporter stocks have been cut from 65.8 to 62.5 MMT — a much smaller exportable cushion even as consumption rises.
RUSSIA & UKRAINE
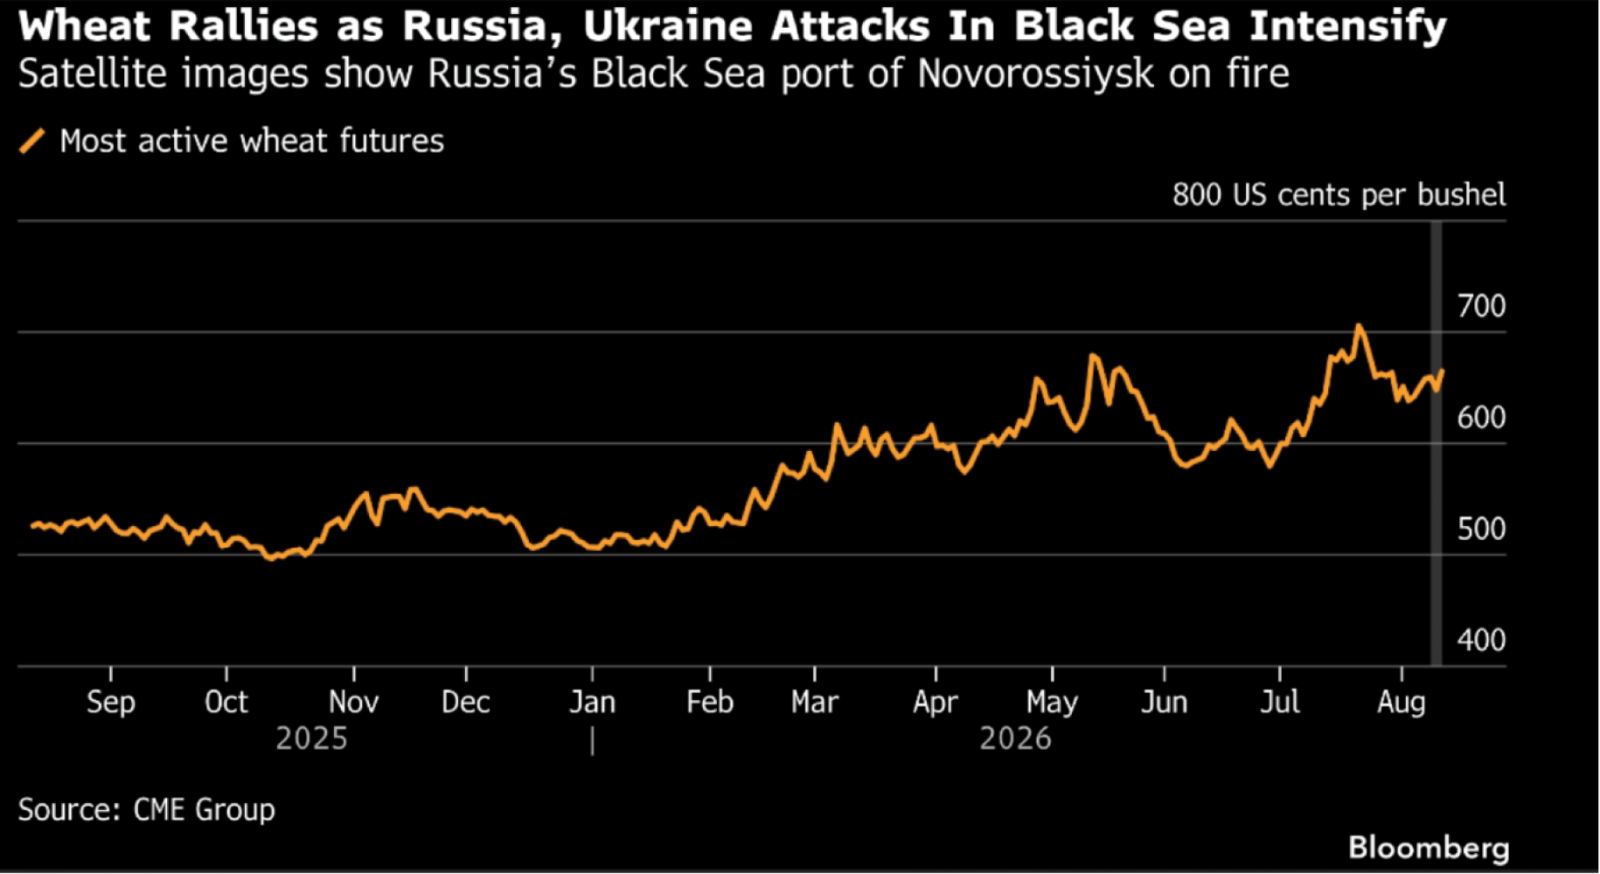
Russia and Ukraine together are expected to account for more than 30% of global wheat exports in 2026–27. USDA has cut Russia's exports to 46 MMT and Ukraine's to 13.5 MMT, while Russia's August shipments are running at only 3.0–3.4 MMT versus a five-year average near 5 MMT. Ukraine has nearly 23 MMT of unsold grain stranded by export disruptions — increasingly a market-access problem rather than a production one. The conflict has expanded across the Black Sea, with Ukraine targeting Russian export infrastructure and Russian strikes restricting shipping from Ukrainian ports; a quick diplomatic solution appears unlikely.
China holds around 121 MMT of wheat stocks — roughly 44% of global inventories — much of which is unavailable to international buyers. Dry conditions in the southern US Plains could add further supply risk ahead of the 2027 winter wheat crop. Wheat traded around $6.64/bushel on August 19, up about 31% year-on-year.
Risks and Assumptions related to Back-tested trading strategies
Disclaimer:Century Financial Consultancy LLC (CFC) is licensed and regulated by the Capital Market Authority (CMA) of the UAE under license numbers 20200000028 and 301044 to carry out the activities of Financial Products dealer, Trading Broker in international markets, Trading Broker of OTC derivatives and currencies in the spot market, Introduction, Financial Consultations, and Promotion. CFC is incorporated under UAE law, registered with the Dubai Economic Department (No. 768189), with its office at 601, Level 6, Building No. 4, Emaar Square, Downtown Dubai, UAE, PO Box 65777.
Terms and Conditions of Access
By accessing and continuing to use the Publication (which includes this document, flyer, charts, diagrams, illustrations, images, calculations, scenario analysis, and related data or content), you confirm that you have read, understood, and agreed to the terms of this Disclaimer.
CFC reserves the right to amend or update the Publication and this Disclaimer at any time without prior notice. Continued use following any such update constitutes your acceptance of the revised terms. If you do not agree with these terms, please discontinue use of the Publication.
Purpose and Intended Use
This Publication is classified as marketing material and should not be regarded as independent investment research. It is provided for informational, educational, and illustrative purposes only and does not constitute investment advice, a recommendation, an offer, or a solicitation to buy or sell any financial instruments or services. All views expressed are general market commentary and may not reflect the opinions of CFC as a whole.
Risk Disclosures and Limitations
The information presented does not cover all the risks associated with the products or scenarios discussed. Please refer to the full Risk Disclosure Statement available on our website.
This Publication reflects information available at the time of preparation and does not account for subsequent developments. Any forward-looking statements involve assumptions and uncertainties; actual outcomes may differ materially. CFC does not guarantee the accuracy, completeness, or reliability of the information and disclaims liability for any action taken based on it.
No Offer or Contractual Commitment
No part of this Publication constitutes an offer, agreement, or commitment to enter into any transaction. Distribution of this Publication does not oblige CFC to engage in any trade or provide any services. Product names or terms may differ across platforms or providers. This material should not be interpreted as legal, regulatory, tax, accounting, or credit advice. Recipients should seek independent professional advice and assess their own financial situation, objectives, and risk profile before making investment decisions.
Data Sources and Interpretation
This Publication may rely on publicly available data, third-party information, or model-based assumptions. CFC makes no representation or warranty as to their accuracy or completeness. Data limitations, errors, or outdated inputs may impact the reliability of projections or scenarios. Names of financial products may differ from those used on trading platforms.
Use, Reproduction, and Analyst Disclosure
This Publication is intended solely for the recipient’s informational use. It may not be copied, transmitted, or distributed in any form, wholly or partially, without prior written permission from CFC.
Analyst Declaration: The Analyst(s) certifies that all opinions expressed in this Publication represent their own independent views and that reasonable care was taken to ensure objectivity. They do not hold securities in the companies mentioned, and their compensation is not linked to the views expressed. CFC’s research and marketing divisions operate independently.
Trading Risk Warning:
Trading in financial products involves significant risk. Leveraged OTC derivatives, such as Contracts for Difference (CFDs) and spot forex contracts, carry a high risk of loss that can potentially exceed initial deposits and may not be suitable for all investors. These instruments do not confer ownership of underlying assets. Investors must carefully evaluate their investment objectives and risk tolerance, and consult independent advisors where appropriate.
__706859886.jpg)





تنظمها هيئة الأوراق المالية والسلع
سنشري للاستشارات المالي ش.ذ.م.م


تصل إلينا:
-
دبي
الطابق رقم 6, مبنى رقم 4, ساحة إعمار دبي
وسط مدينة دبي، ص.ب: 65777،
دبي، الإمارات العربية المتحدة -
Abu Dhabi
27th Floor, Office 2701,
Shining Towers, Abu Dhabi, UAE -
Sharjah
29th Floor, Office 2905,
The Business Tower, Sharjah, UAE - +971 (4) 356 2800
- info@century.ae

Century Financial is the presenting sponsor of

ينطوي التداول في المنتجات المالية على مخاطر كبيرة. فالاعتماد على المشتقات المالية المتاحة للتداول خارح البورصة، مثل عقود الفروقات وتداول العملات الأجنبية (الفوركس) الفوري، قد يتسبب في خسائر تتجاوز قيمة الإيداعات الأولية، مما يجعلها غير ملائمة لجميع المستثمرين. فهذه الأدوات المالية المعقدة لا تمنح ملكية مباشرة للأصول الأساسية. لذا، ينبغي للمستثمرين الاحتراز عند تحديد أهدافهم الاستثمارية ومراعاة مستوى المخاطرة المتوقَع، واللجوء إلى الاستشارة المهنية المتخصصة عند الضرورة.
سنشري للإستشارات والتحليل المالي ش.ذ.م.م (الشركة)، شركة مرخّصة ومنظمة من هيئة الأوراق المالية والسلع في دولة الإمارات العربية المتحدة، بموجب الترخيص رقم (20200000028) و(301044) لتولي أعمال الوساطة في الأسواق الدولية، وتداول المشتقات المالية والعملات المتاحة للتداول خارج البورصة في سوق التداول الفوري، بالإضافة إلى تقديم الخدمات الاستشارية والترويجية. تأسست الشركة بموجب قوانين دولة الإمارات العربية المتحدة، وهي مسجلة لدى دائرة التنمية الاقتصادية بدبي (رقم: 768189)، حيث يقع مكتبها المسجّل في 601، الطابق السادس، المبنى رقم 4، ميدان إعمار، وسط مدينة دبي، دولة الإمارات العربية المتحدة، ص.ب. 65777.
لا يُعرَض محتوى هذا الموقع الإلكتروني إلا لأغراض تعريفية تثقيفية بحتة، فلا يمثل عرضًا ولا توصيةً ولا دعوةً لشراء أو بيع أي أوراق مالية أو منتجات مالية.
لا تنوي الشركة استخدام أو توزيع منتجاتها وخدماتها في أي ولاية قضائية حيث يُشكِّل هذا الاستخدام أو التوزيع انتهاكًا للقوانين المحلية أو اللوائح التنظيمية.
