.jpg)
Market prices tend to showcase a trend or pattern which is indicative of whether the price will continue in the same direction or if it will reverse. Harmonic price patterns do just that with the added benefit of being more precise. This is because only specific price movements based on Fibonacci retracements and extensions qualify in the formation of a harmonic pattern. This eliminates a substantial degree of subjectivity.
Like all good patterns, harmonic patterns are best traded once they are formed completely.
Trading harmonic patterns require patience, but when applied correctly, they provide wonderful insights into potential future price movements. So let’s learn some of the patterns traders can use to make a successful trade.
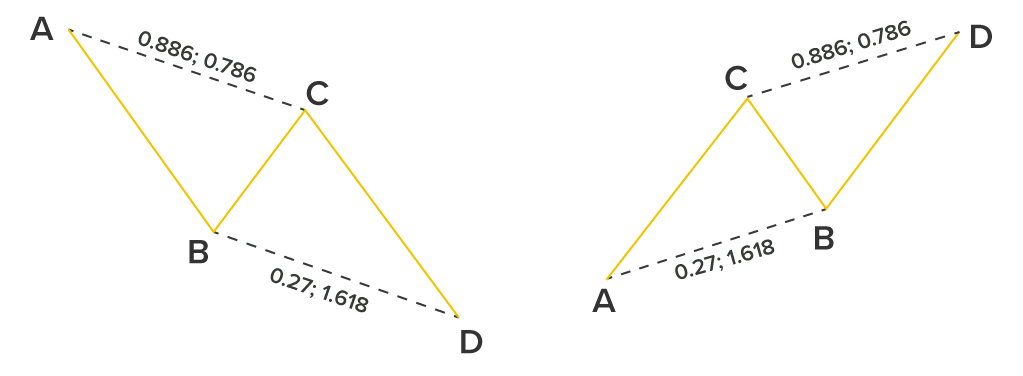
The ABCD Pattern
Deemed by many as the simplest pattern of them all, the ABCD pattern comprises of four points and three movements. The movements include

The pattern’s name derives from the concept that AB = CD. , When the Fibonacci retracement tool is used on the AB leg, the BC leg should touch 0.618 for it to be the same length as AB. The time taken for C to reach D should be equal to the time taken for A to reach B. This allows traders to either choose their point of entry close to C, which is known as Potential Reversal Zone (PRZ) or wait till the pattern completes itself before deciding on a position.
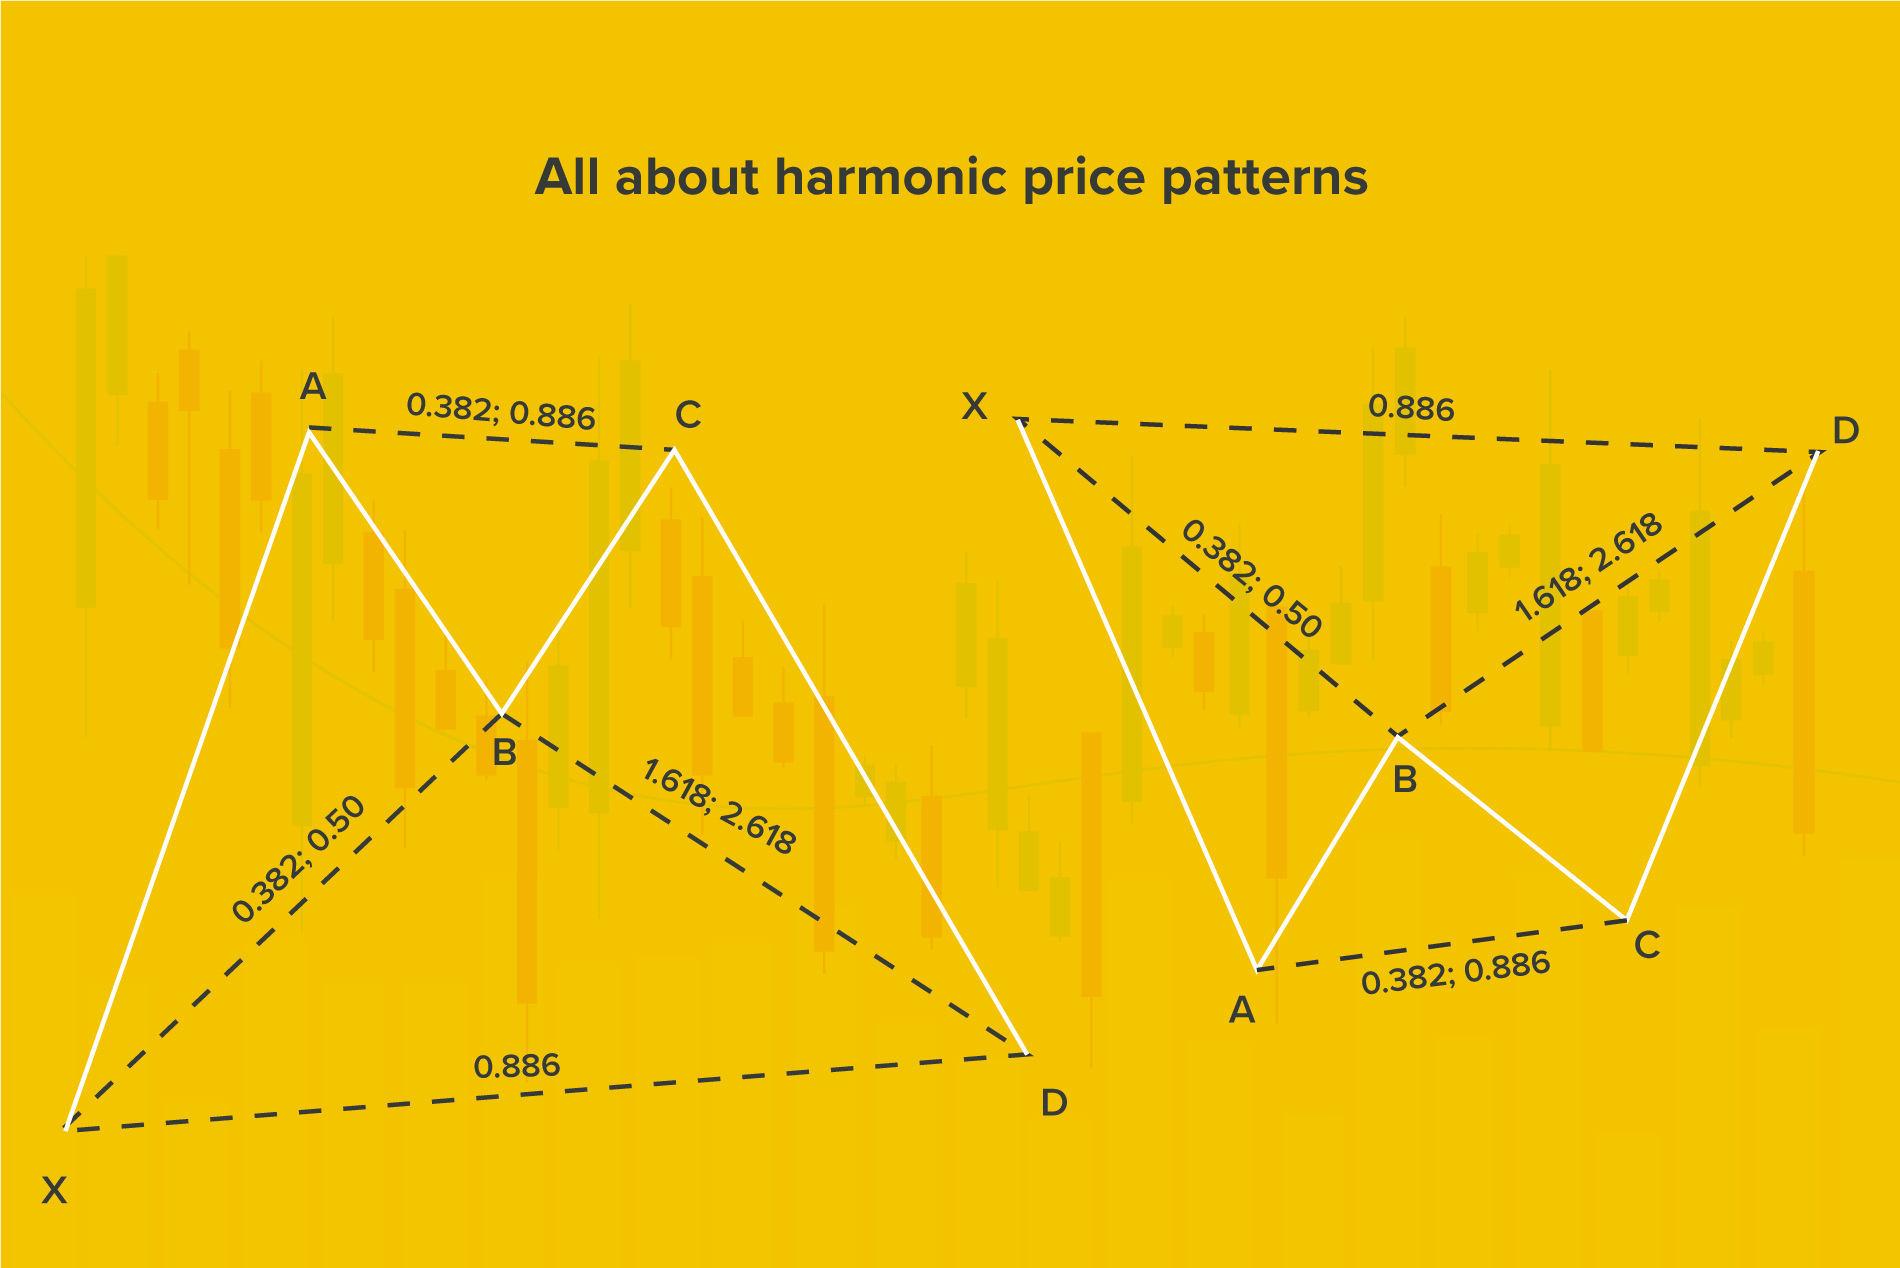
The BAT pattern
First recognized by Scott Carney, this pattern occurs when the trend reverses temporarily, making it a useful tool for scalpers. . Unlike the ABCD pattern, it has an additional leg and point called ‘X’. This pattern appears similar to the Gartley pattern but the ratios are not identical.
The BAT pattern formation is a 5-point retracement structure with a specific Fibonacci measurement for each point. Generally, D entails a zone where the price tends to reverse. When the first leg, XA,moves to a BC retracement, and the retracement stops at 50% of the movement from point B to XA, we see the emergence of the BAT pattern. The CD extension, at the very least, must be 1.618 of the BC leg and should reach 2.618. The figure will be deemed invalid if it is less than the BC. The endpoint (D) will create the PRZ, allowing traders to choose their positions.

The Gartley pattern
Created by Harold McKinley Gartley, the Gartley pattern has similarities to the BAT pattern. It is a simple harmonic pattern that occurs after a substantial low or high, or usually when a correction of the trend is about to happen.
The qualifying factors for a Gartley pattern are:
Remember, when you develop a trading strategy, the stop-loss point is placed at X, and the take-profit is set at C.

The butterfly pattern
Identified by Bryce Gilmore, the butterfly pattern is used to recognize potential retracements through a combination of Fibonacci ratios. As a reversal pattern which often occurs towards the end of a trend, it is comprised of four legs, which are marked as XA, BC, AB, and CD.
For traders that use this pattern, the ratio they need to identify the most is 0.786 retracement of the XA leg. It will help to plot point B, thus assisting traders in recognizing the PRZ.
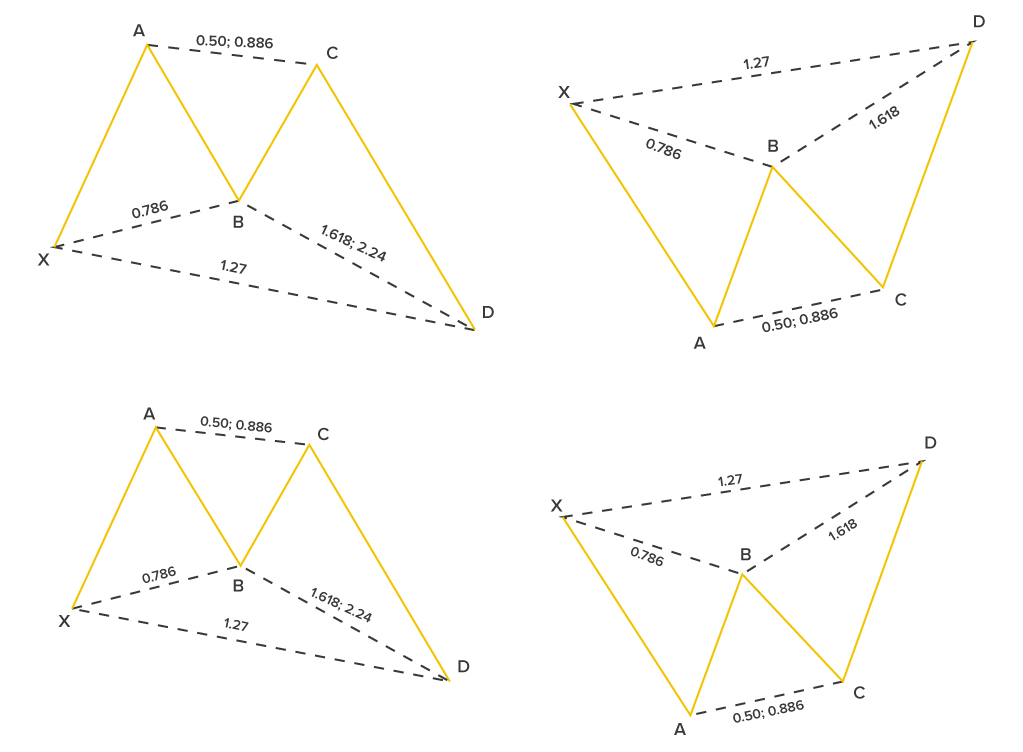

The crab pattern
The crab pattern is meant for traders that seek a trading strategy to enter during extreme highs or lows. It follows a C-D, B-C, A-B and X-A pattern, with its most relevant feature being the 1.618 extensions of the XA movement to identify the PRZ.
In its bullish version, when there is a sharp rise from X to A, the first leg is formed. The AB leg, which retraces between 38.2% and 61.8%, is subsequently followed by an extreme projection of BC to identify the pattern’s completion and the potential reversal of the trend. In the bearish version, it will keep an eye out for a dip from X to A, which is followed by a slight price rise, then a slight decline, and a sharp rise to point D.

Every trader seeks to be successful, and harmonic patterns can help you get there. Moreover, if plotted correctly, these patterns can be a reliable trading tool.
This marketing and educational content has been created by Century Financial Consultancy LLC (“Century”) for general information only. It does not constitute investment, legal, tax, or other professional advice, nor does it constitute a recommendation, offer, or solicitation to buy or sell any financial instrument. The material does not take into account your investment objectives, financial situation, or particular needs.
The opinions expressed by the hosts, speakers, or guests are their own and may change without notice. Information is based on sources we consider to be reliable; however, Century does not guarantee its accuracy, completeness, or timeliness and accepts no liability for any loss arising from reliance on this content.
Trading and investing involve significant risk, and losses may exceed initial deposits. Past performance is not indicative of future results. CFDs and other leveraged products are complex instruments that may not be suitable for all investors. Please ensure you understand how these products work, the associated risks, and seek independent professional advice if necessary.
Century is licensed and regulated by the UAE Capital Market Authority (CMA) under License Nos. 20200000028 and 301044.
Please refer to the full risk disclosure mentioned on our website.
__800359981.jpg)


__1646000592.png)


Regulated by CMA
Century Financial Consultancy LLC


.png)
.png)
.png)
.png)
.png)

Reach us:
-
Dubai
6th Floor, Emaar Square Building 4,
Downtown, Dubai, P.O. Box 65777,
Dubai, United Arab Emirates -
Abu Dhabi
27th Floor, Office 2701,
Shining Towers, Abu Dhabi, UAE -
Sharjah
29th Floor, Office 2905,
The Business Tower, Sharjah, UAE - +971 (4) 356 2800
- info@century.ae

Disclaimer: Trading in financial products carries substantial risk. Leveraged over-the-counter (OTC) derivatives, such as Contracts for Difference (CFDs) and spot forex, may result in losses exceeding initial deposits and may not be suitable for all investors. These complex instruments do not confer ownership of the underlying assets. Investors should carefully consider their investment objectives and risk appetite, and seek independent professional advice if necessary.
Century Financial Consultancy LLC (CFC) is licensed and regulated by the Capital Market Authority (CMA) of the UAE under license numbers 20200000028 and 301044 to carry out the activities of Financial Products dealer, Trading Broker in international markets, Trading Broker of OTC derivatives and currencies in the spot market, Introduction, Financial Consultations, and Promotion. CFC is incorporated under UAE law, registered with the Dubai Economic Department (No. 768189), with its office at 601, Level 6, Building No. 4, Emaar Square, Downtown Dubai, UAE, PO Box 65777.
The content on this website is provided solely for informational and educational purposes and does not constitute an offer, recommendation, or solicitation to buy or sell any securities or financial products.
Products and services offered by CFC are not intended for use in any jurisdiction where such use or distribution would breach local laws or regulatory requirements.
⚠️ Alert: Fraudulent Activity Notice
Century Financial Consultancy LLC (“Century”) has become aware of fraudulent individuals and entities impersonating our firm through unofficial websites, social media channels, and messaging applications such as Telegram, WhatsApp, and Discord.
Please be advised:
- Century does not manage investments on behalf of clients.
- Century does not solicit funds or guarantee investment returns.
- Century does not accept or make payments in cash, cryptocurrency, or digital assets.
- We do not conduct business via social media or messaging platforms.
Our only official website is www.century.ae, and all communication is conducted exclusively through verified channels.
We strongly urge the public to remain vigilant, verify the authenticity of any communication claiming to be from Century, and report any suspicious activity. Century disclaims any responsibility for losses arising from dealings with unauthorised or fraudulent parties.
