

Introduction to Chart Patterns in Technical Analysis
Stock chart patterns arevisual representations of price movements that help traders forecast future price action. Recognizingthese patterns gives traders a significant edge by identifying key market trends, potential reversals,and breakout points. Whether you're swingtrading or scalping, these patterns are invaluable tools for timing your trades effectively.
What Are Stock Chart Patterns?
Stock chart patterns are specific formations created by price movements on a chart. These patterns indicate potential future price movements based on historical behavior. Traders use them to identify market sentiment, trend continuation, or reversal signals. Chart patterns are typically classified into three categories:

Continuation patterns:
Suggest the existing trend will continue
(e.g., flags, pennants).
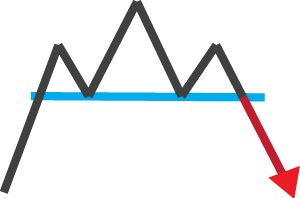
Reversal patterns:
Indicate a change in the direction of the trend
(e.g., double tops, head and shoulders).
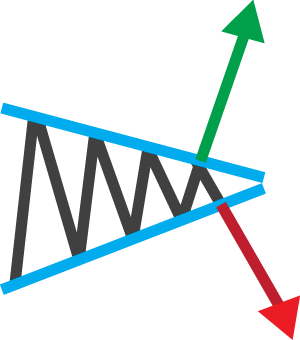
Neutral patterns:
Can break either way, depending on other factors
(e.g. symmetrical triangle).
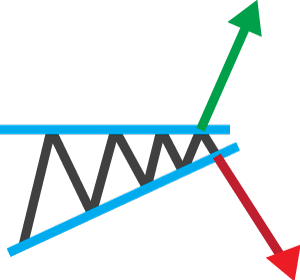
Ascending Triangle
How to Trade It
Enter the trade when price breaks above resistance with high volume. Place a stop-loss just below the rising trendline.
Target price can be calculated by measuring the height of the triangle and adding it to the breakout level.
Traders often wait for a strong candle close above resistance to confirm the breakout.
Volume should ideally increase on the breakout day to validate the move.
Common Mistakes to Avoid
Avoid entering before confirmation of breakout. Watch out for false breakouts with low volume.
Many traders set stop-losses too close to the breakout point, increasing the risk of being stopped out.
Ignoring market context—like overall trend or news—can lead to poor trade timing.
Always ensure proper risk-reward ratio before committing capital to the setup.
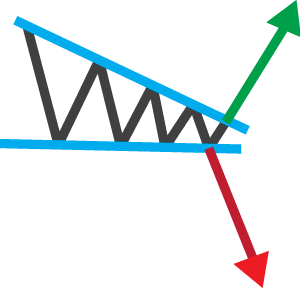
Descending Triangle
How to Trade using descending triangle
Enter short positions when price breaks below support on strong volume. Set stop-loss above descending resistance.
Use a target based on the height of the triangle subtracted from the breakdown point to estimate potential profit.
Traders can also scale into positions as the breakout confirms to manage risk better. Confirmation through other indicators like RSI or MACD can increase the trade’s reliability.
Mistakes to Avoid
Don’t anticipate the breakdown too early. Ensure confirmation with strong bearish candles.Avoid trading in low-volume markets as it increases the chance of a false breakout.
Some traders mistakenly assume all descending triangles will break down—always wait for confirmation before entry.
Failing to adjust stop-loss in fast-moving markets can turn a winning trade into a loss.
Pennant Pattern
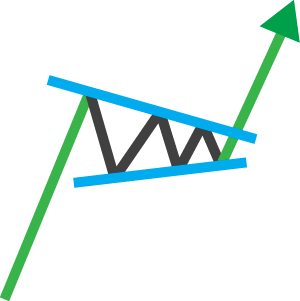
Strategy to Trade
Enter the trade in the direction of the flagpole once the breakout occurs. Set targets based on the initial move length.
Ensure volume picks up during the breakout to validate the move.
Use trailing stop-losses to capture extended runs while managing downside risk.
Confirm pattern integrity with tools like moving averages or RSI.
Flag Pattern
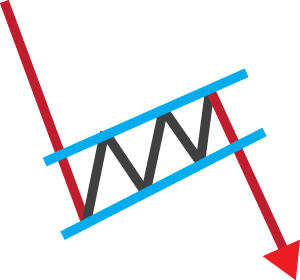
How to Trade It
Look for a breakout in the direction of the prior trend. Volume confirmation strengthens reliability.
Set profit targets using the length of the flagpole projected from the breakout point.
Stop-loss should be placed below the flag’s lower boundary (in bullish cases) or above it (in bearish cases).
Use MACD or RSI divergence as additional breakout confirmation.
Wedge Pattern
Rising Wedge: Bearish reversal
Occurs when price makes higher highs and higher lows, but upward momentum weakens.
Often seen in uptrends that are losing steam, hinting at an upcoming decline.
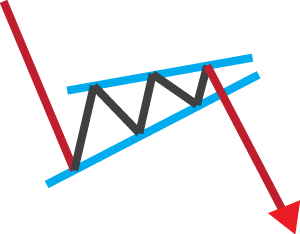

Rising Wedge: Bullish reversal
Price makes lower highs and lower lows but the downtrend slows.
Usually signals that sellers are losing control, leading to an upside breakout.

Trading Strategy
Use trendline breaks as entry points. Confirm with volume and momentum indicators.
Wait for a decisive breakout from the wedge boundary with volume support.
Projected targets can be set using the height of the wedge pattern, Avoid entering during mid-pattern formation as it can lead to false signals.
Double Bottom
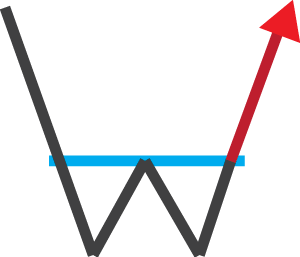
Trading the Pattern
Buy after the neckline breakout. Target price is the distance from bottoms to neckline added to breakout point.
Volume should increase at the breakout for higher reliability.
Top-loss can be placed just below the second bottom to limit downside risk.
The pattern becomes more valid on higher timeframes like daily or weekly charts.
Double Top
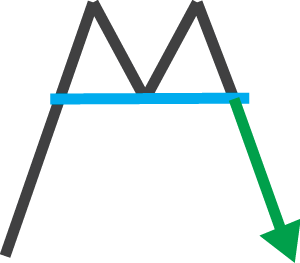
Entry Strategy
Sell after price breaks below the neckline. Set stop-loss above the recent high.
Volume should increase during the breakdown to validate the move.
Target can be set by measuring the height between the peaks and neckline.
Avoid entering trades before confirmation, as double tops can evolve into sideways ranges.
Head and Shoulders
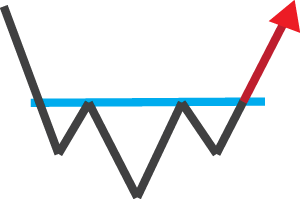
How to Trade It
Enter short after the neckline break. Use the height from head to neckline for price targets.
Stop-loss can be placed just above the right shoulder for risk control.
Wait for a clear and clean neckline breakout with volume increase to confirm validity.
Volume should ideally decrease on the right shoulder, showing fading buying pressure.
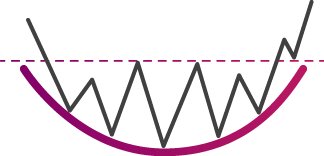
Head and Shoulders
Trading Strategy
Buy when price breaks resistance with volume. Often signals the beginning of a long-term uptrend.
The breakout point acts as a neckline and confirms a shift in market sentiment.
Targets can be set based on the height of the rounding formation.
Combine with long-term moving averages to strengthen confirmation.
Double Top
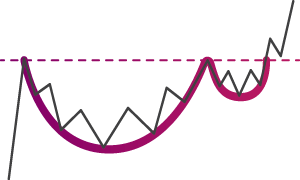
Trade Setup
Enter after handle breakout with stop-loss below the handle low. Target the cup's depth added to breakout.
Watch for a volume surge during breakout to confirm pattern strength.
Ideal for medium- to long-term trades in trending markets.
Handles that are too deep or lengthy may invalidate the pattern’s reliability.
Trading Chart Types Explained
Rising Wedge: Bearish reversal
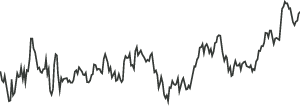
Simple but limited, shows closing prices only.
It's useful for identifying overall trends and comparing different assets quickly.
However, it lacks detail about intraday price movements and volatility.
Best used for long-term trend analysis or overlaying multiple instruments.

Falling Wedge: Bullish reversal
Price makes lower highs and lower lows but the downtrend slows.
Usually signals that sellers are losing control, leading to an upside breakout.

Candlestick Chart

How to Spot Chart Patterns Effectively
Use trading tools or scanners like Century Financial's Pattern Recognition Scanner, which identifies patterns in real-time across 120+ products, updated every 15 minutes.
This tool helps remove subjectivity and speeds up decision-making.
Look for confluence: a chart pattern plus support from volume, trendlines, or indicators.
Common Mistakes Traders Make with Chart Patterns
Successful traders combine doji candles with market context, price action, and confirmations for consistent results.
Indicators to Combine with Chart Patterns
Enhance accuracy by pairing patterns with these indicators:
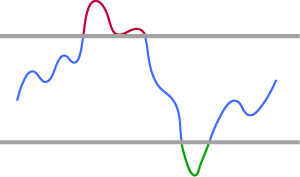
RSI
Confirms overbought/oversold conditions

MACD
Validates trend reversals
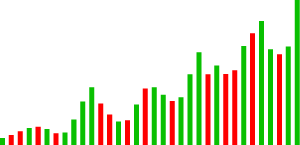
Volume Spike:
Confirms breakout strength
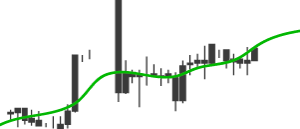
Moving Averages
Help with trend identification
Real-World Example of Using Chart Patterns
A trader spots a cup and handle pattern on Tesla's daily chart. Volume increases during breakout, and RSI confirms upward momentum. Trade is executed with a 15% gain in two weeks, following a textbook pattern.
FAQs About Stock Chart Patterns
Q1. Are chart patterns reliable for trading?
A: They offer high probability signals when combined with volume and indicators but aren’t foolproof.
Q2: Can beginners use chart patterns?
A: Yes. Start with simple patterns like double top/bottom and flags before advancing.
Q3: Do chart patterns work in all markets?
A: They are effective in stocks, forex, and crypto, but always test for context.
Q4. How long should I wait for a breakout confirmation?
A: Ideally, wait for a strong candle close outside the pattern with volume support.
Conclusion: Chart Patterns as a Trading Edge
Learning stock chart patterns is like learning a new language—the more fluent you are, the better your trading decisions. When used properly with confirmation tools, these 11 patterns can significantly enhance your ability to identify profitable trades. Combine them with sound risk management and market awareness for best results.
This marketing and educational content has been created by Century Financial Consultancy LLC (“Century”) for general information only. It does not constitute investment, legal, tax, or other professional advice, nor does it constitute a recommendation, offer, or solicitation to buy or sell any financial instrument. The material does not take into account your investment objectives, financial situation, or particular needs.
The opinions expressed by the hosts, speakers, or guests are their own and may change without notice. Information is based on sources we consider to be reliable; however, Century does not guarantee its accuracy, completeness, or timeliness and accepts no liability for any loss arising from reliance on this content.
Trading and investing involve significant risk, and losses may exceed initial deposits. Past performance is not indicative of future results. CFDs and other leveraged products are complex instruments that may not be suitable for all investors. Please ensure you understand how these products work, the associated risks, and seek independent professional advice if necessary.
Century is licensed and regulated by the UAE Capital Market Authority (CMA) under License Nos. 20200000028 and 301044.
Please refer to the full risk disclosure mentioned on our website.






.png)
.png)
.png)
.png)


