Friday, April 17, 2026
Crisis to Comeback: Gold's Historical Recovery After Market Shocks
By Century Financial in 'Investment Insights'
.jpg)
Precious Metals · Comparative Analysis · Historical Drawdowns
Crisis to Comeback:
Gold's Historical Recovery
After Market Shocks
A forensic examination of how gold — the world's oldest safe-haven asset — has drawn down and rebounded across three defining market crises, tracking the speed of each decline, and the trajectory of recovery over a three-year window.
25 March 2026 · Source: Bloomberg
Gold has always been a reliable refuge in times of uncertainty — but what is often overlooked is how it behaves in the earliest stages of a crisis. During moments of extreme stress, gold can initially sell off alongside risk assets. This isn't a fundamental shift in its appeal; it's a liquidity reaction. When losses mount elsewhere, investors sell what they can — and gold, being one of the most liquid assets available, is often caught in that scramble for cash. But that phase tends to be short-lived, and what follows is typically far more important.
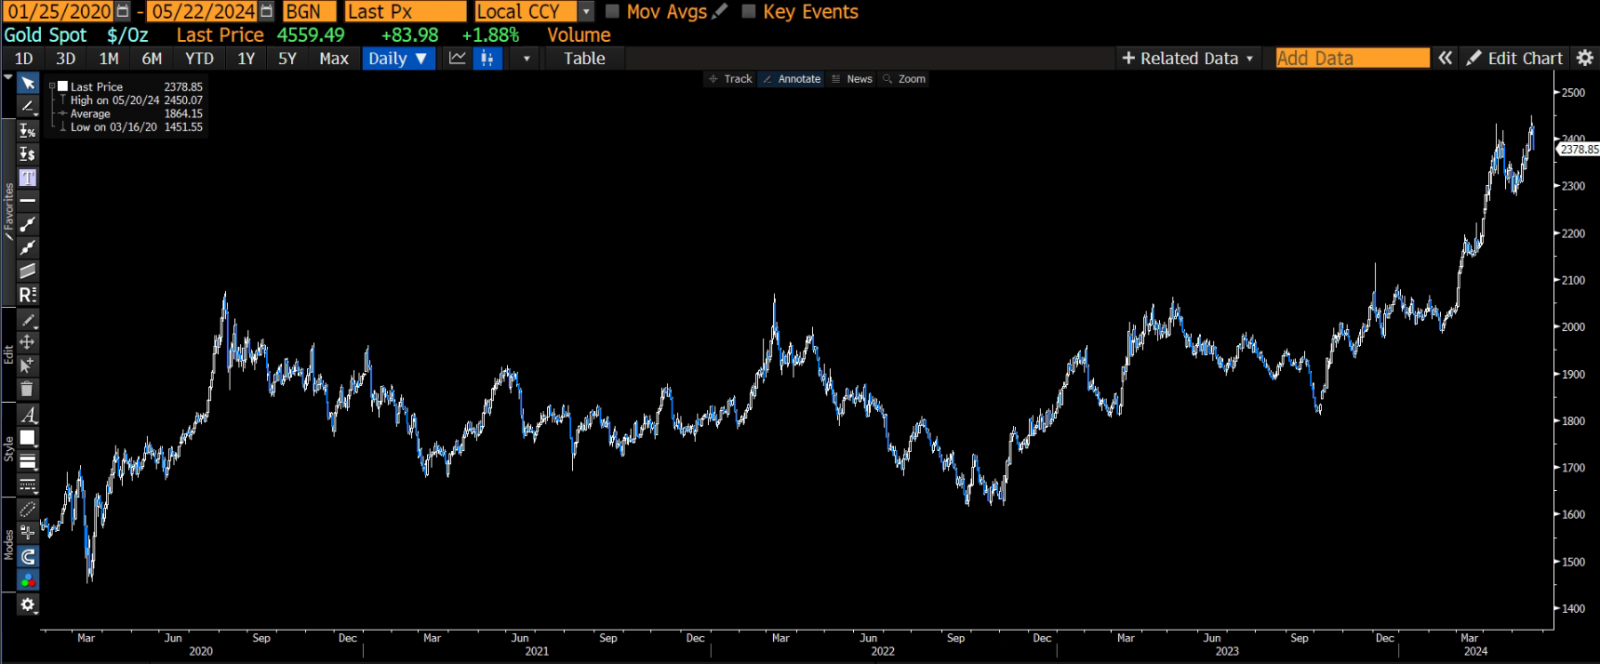
Once the initial panic settles, gold tends to find its footing and recover strongly. Real yields peak and drift lower, the U.S. dollar softens, and gold quietly resumes its role as a dependable store of value — drawing back the very investors who sold it in the first place. That same dynamic appears to be playing out now: following the escalation in U.S.–Israel–Iran tensions, gold dropped nearly 24% between 28 February and 23 March 2026, before finding support near its 200-day moving average around $4,083. It remains approximately 15% below pre-conflict levels as of 25 March 2026 — suggesting the recovery phase may still have room to run. This analysis examines how gold behaved across three major past crises — from the depth and speed of its initial declines to the strength and consistency of its recoveries over the subsequent three years.
At a Glance
Headline Figures — All Three Crises
| Crisis | Peak Price | Trough Price | Drawdown | Days to Trough | 6 Months | 1 Year | 2 Years | 3 Years |
|---|---|---|---|---|---|---|---|---|
| 2008 Global Financial Crisis Peak: 17 Mar 2008 Trough: 24 Oct 2008 |
$1,031.90 | $682.50 | −33.9% | 221 days | +24.2% | +43.7% | +80.8% | +125.1% |
| Covid-19 Pandemic Peak: 9 Mar 2020 Trough: 20 Mar 2020 |
$1,703.30 | $1,455.00 | −14.6% | 11 days | +30.2% | +16.5% | +28.2% | +32.0% |
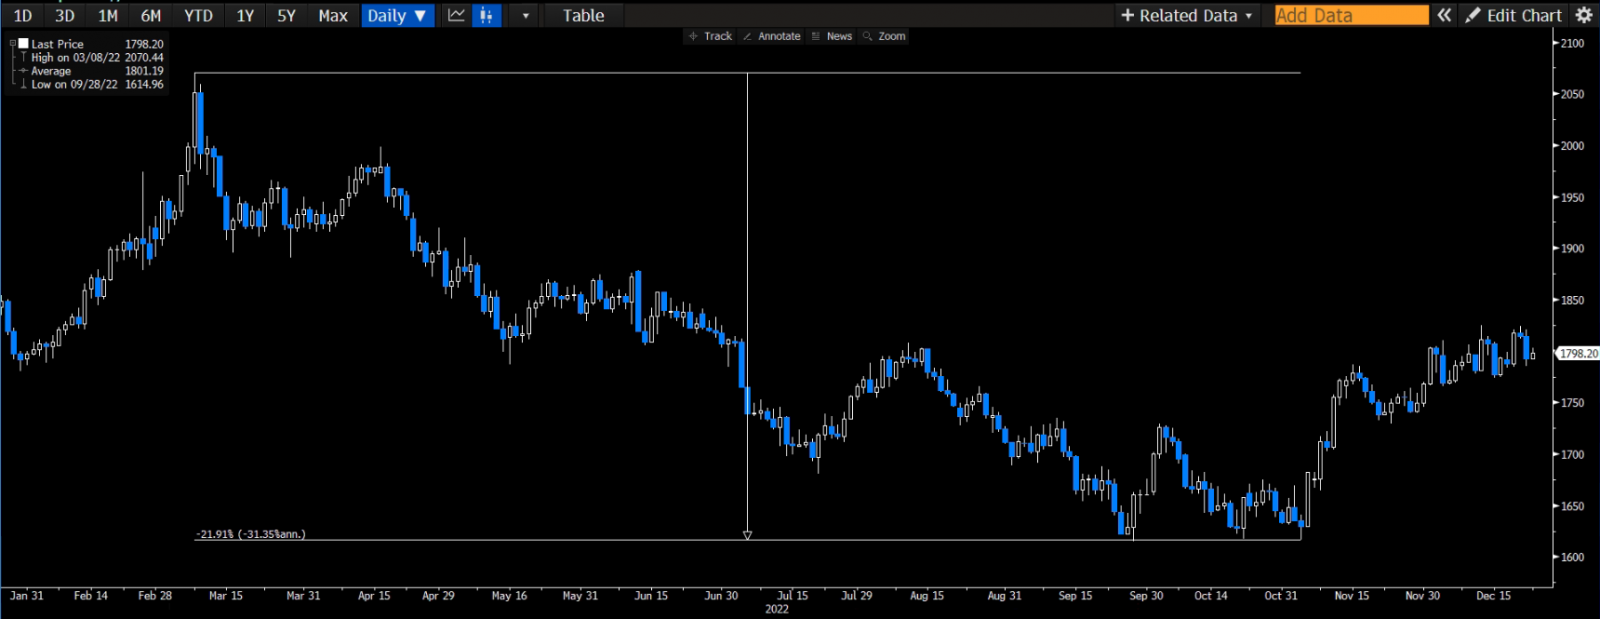
| Russia–Ukraine War Peak: 8 Mar 2022 Trough: 3 Nov 2022 |
$2,070.40 | $1,616.70 | −21.9% | 240 days | +25.1% | +22.3% | +67.9% | +145.6% |
Date: 25 March 2026 Source: Bloomberg Recovery returns are calculated from the trough price in each crisis.
Crisis 1
2008 Global Financial Crisis
2008 Global Financial Crisis
Aug 2007 – Mar 2009
Pre-crisis peak: 17 March 2008 · Trough: 24 October 2008
Drawdown
−33.9%
$1,031.90 → $682.50
Days to Trough
221
days
3-Year Recovery
+125.1%
from trough
Phase 1 — Pre-crisis peak
17 March 2008
$1,031.90
Pre-crisis local high
Phase 2 — Trough (221 days later)
24 October 2008
$682.50
▼−33.9% drawdown
Phase 3 — 3-Year Recovery
From trough
+125.1%
▲3-year return from $682.50
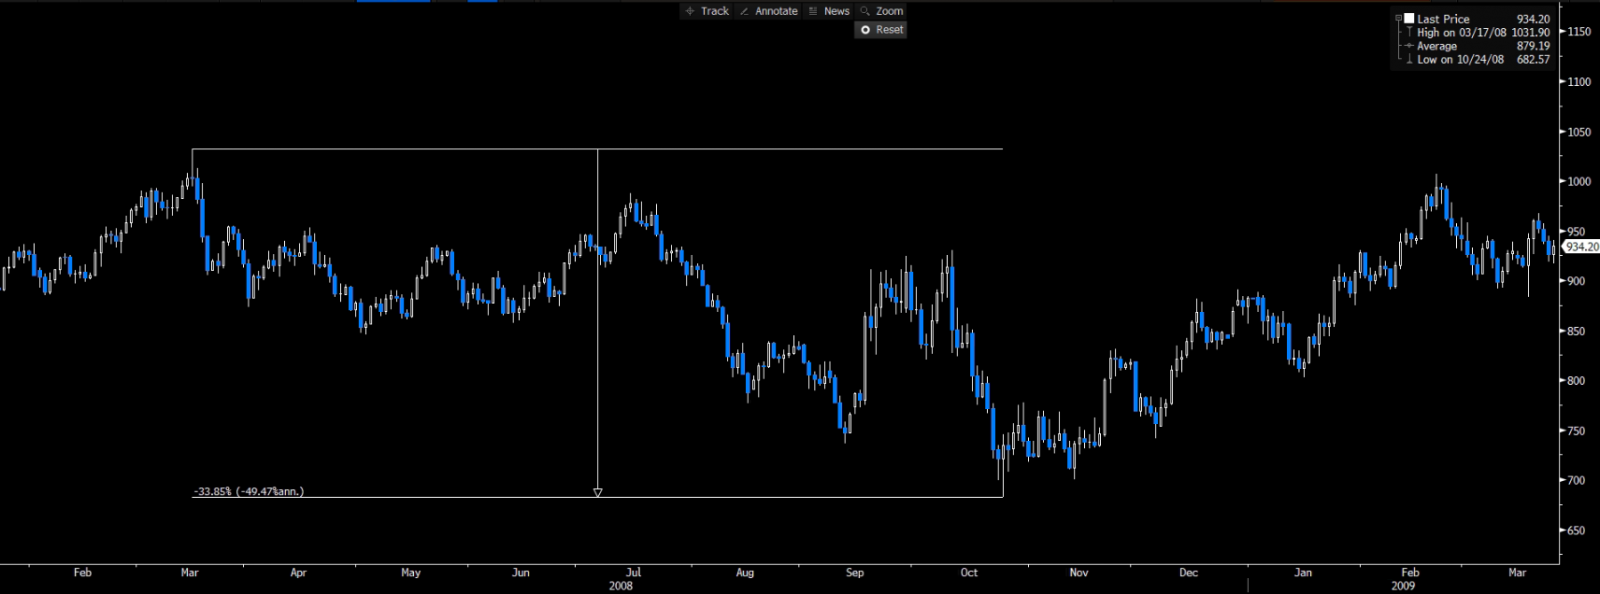
Drawdown Chart
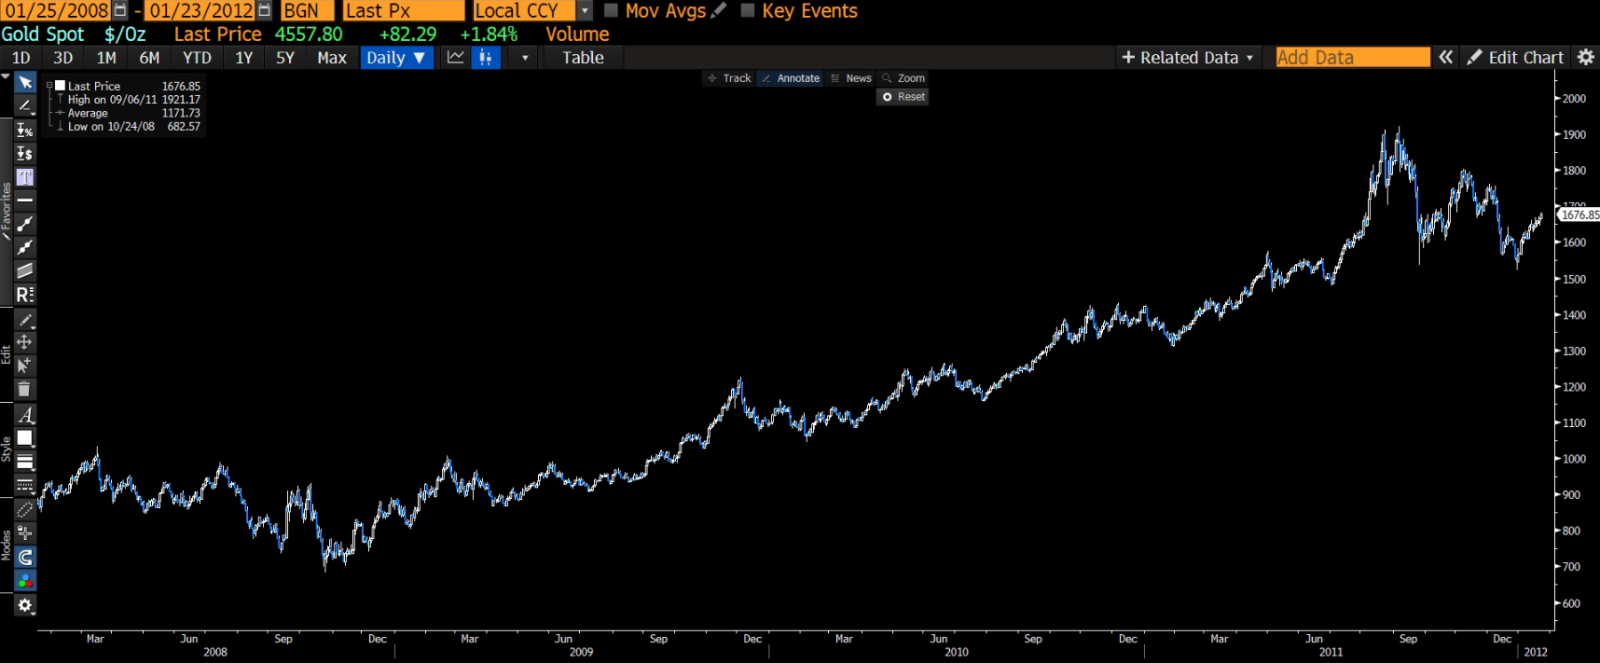
Recovery Chart
Date: 25 March 2026 Source: Bloomberg
2008 Global Financial Crisis — Key Inferences
Gold took a sharp hit in the early phase of the 2008 financial crisis, dropping by 33.9% over 221 days. But this wasn't because its underlying story had changed — it was more about the intensity of the moment. After the Lehman collapse, markets were gripped by a severe liquidity crunch, and investors, including hedge funds and large institutions, had little choice but to quickly raise cash wherever they could. In that environment, gold, being one of the most liquid assets, was sold alongside equities and other risk assets to meet margin calls and stabilise balance sheets.
The bottom, around $682.50 in late October 2008, marked a key inflection point. As central banks stepped in with aggressive rate cuts and quantitative easing, financial conditions began to stabilise. Real yields peaked and began to decline, the U.S. dollar's strength moderated, and gold's macro tailwinds gradually re-emerged.
From there, gold entered a strong and sustained recovery phase. As the urgency for cash began to ease, investors started looking beyond the immediate crisis and focusing on what all the policy support would mean over the longer term. That shift in mindset helped fuel a strong, multi-year rally in gold, once again highlighting its dual role — both as a hedge during periods of stress and as a beneficiary of the policy measures that usually follow.
Covid-19 Pandemic
March 2020
Pre-crisis peak: 9 March 2020 · Trough: 20 March 2020
Drawdown
−14.6%
$1,703.30 → $1,455.00
Days to Trough
11
days
3-Year Recovery
+32.0%
from trough
Phase 1 — Pre-crisis peak
9 March 2020
$1,703.30
Pre-crisis local high
Phase 2 — Trough (11 days later)
20 March 2020
$1,455.00
▼ −14.6% drawdown
Phase 3 — 3-Year Recovery
From trough
+32.0%
▲ 3-year return from $1,455.00
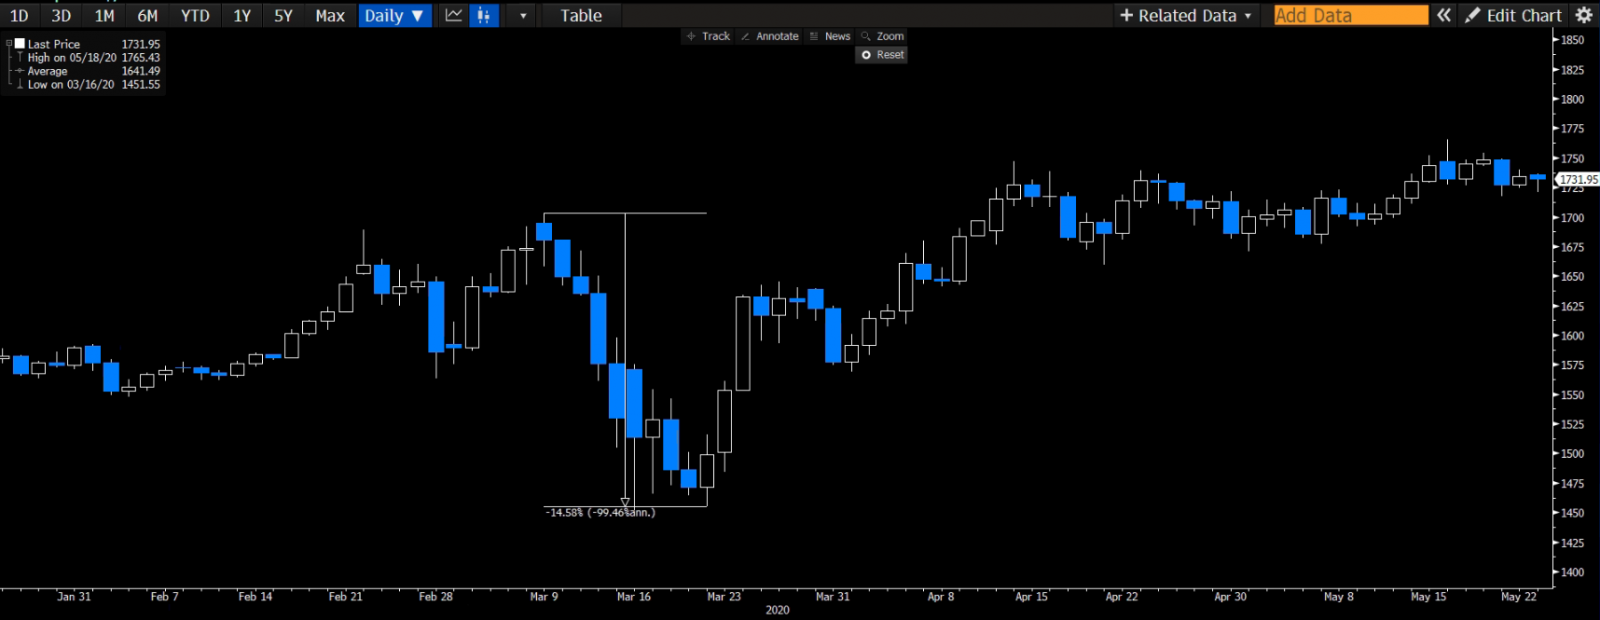
Drawdown Chart
Recovery Chart
Date: 25 March 2026 Source: Bloomberg
Covid-19 Pandemic — Key Inferences
The Covid-19 pandemic saw a sharp but very short-lived drop in gold — a 14.6% decline packed into just 11 days. The speed of the move says a lot about what was driving it. This wasn't a reassessment of gold's fundamentals; it was a pure liquidity shock. As markets seized up in March 2020, investors rushed to raise cash, and even gold was sold in that scramble.
What followed was just as telling: gold rebounded quickly, gaining 30.2% over the next six months — a stronger move than its 1-year return of 16.5%. That kind of pattern is typical of a snap-back after forced selling, where prices recover rapidly once liquidity pressures ease, and then settle into a more gradual consolidation phase, often above pre-crisis levels.
Over a longer horizon, the 3-year return was 32%. Unlike 2008, when gold was coming off lower levels, the scope for outsized upside was naturally more limited, even though the macro backdrop remained supportive.
Russia–Ukraine War
February 2022 – Ongoing
Pre-crisis peak: 8 March 2022 · Trough: 3 November 2022
Drawdown
−21.9%
$2,070.40 → $1,616.70
Days to Trough
240
days
3-Year Recovery
+145.6%
from trough
Phase 1 — Pre-crisis peak
8 March 2022
$2,070.40
Pre-crisis local high
Phase 2 — Trough (240 days later)
3 November 2022
$1,616.70
▼ −21.9% drawdown
Phase 3 — 3-Year Recovery
From trough
+145.6%
▲ 3-year return from $1,616.70
Drawdown Chart
Recovery Chart
Date: 25 March 2026 Source: Bloomberg
Russia–Ukraine War — Key Inferences
Gold's drawdown of −21.9% over 240 days was the most stretched out among the three crises. The pressure largely came from the Fed's aggressive rate hikes, which pushed real yields sharply higher, strengthened the U.S. dollar, and made non-yielding assets like gold less attractive in the near term.
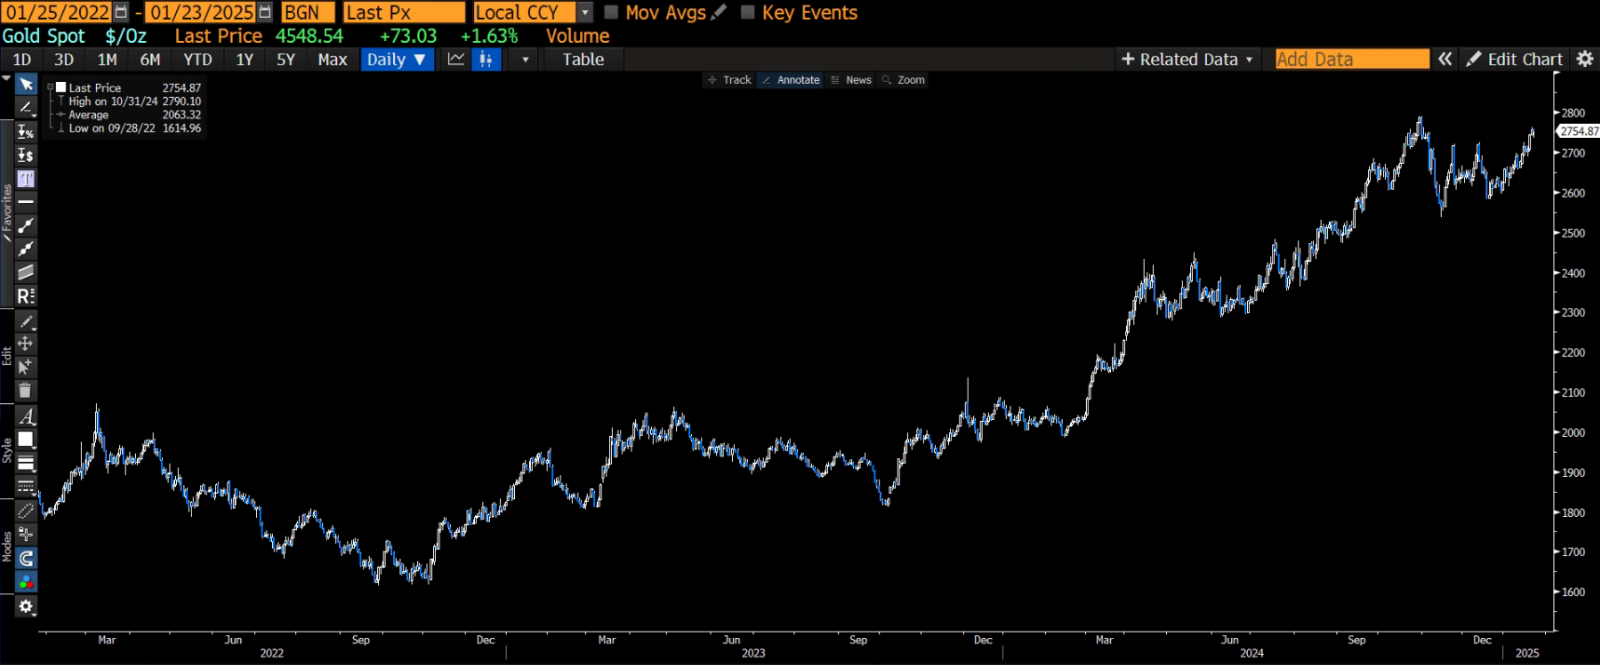
The recovery wasn't immediate — it started off slowly and then gradually gained traction. Early on, the upside was fairly muted, but things began to pick up as markets sensed that rates were nearing their peak and a policy shift could be on the horizon. As real yields eased and the dollar lost some of its strength, gold stabilised and began to move higher with greater conviction. Alongside this, consistent central bank buying quietly added support in the background — it wasn't what kicked off the rebound, but it did help strengthen the longer-term demand story as the recovery unfolded.
The trough around $1,616.70 in November 2022 marked a key turning point. In hindsight, it highlighted a familiar pattern — when gold is pressured by macro factors like rising yields rather than any fundamental shift, those extended drawdowns often offer some of the more compelling entry points for longer-term investors.
Side-by-Side Comparison
All Three Crises — Summary of Gold's Performance
| Metric | 2008 Global Financial Crisis | Covid-19 Pandemic | Russia–Ukraine War |
|---|---|---|---|
| Pre-Crisis Peak Price | $1,031.90 / oz | $1,703.30 / oz | $2,070.40 / oz |
| Trough Price | $682.50 / oz | $1,455.00 / oz | $1,616.70 / oz |
| Drawdown from Peak | −33.9% | −14.6% | −21.9% |
| Days to Trough | 221 days | 11 days | 240 days |
| Recovery — 6 Months | +24.2% | +30.2% | +25.1% |
| Recovery — 1 Year | +43.7% | +16.5% | +22.3% |
| Recovery — 2 Years | +80.8% | +28.2% | +67.9% |
| Recovery — 3 Years | +125.1% | +32.0% | +145.6% |
|
Average — All 3 Crises
6 Months +26.5%
1 Year +27.5%
2 Years +59.0%
3 Years +100.9%
|
|||
Date: 25 March 2026 Source: Bloomberg Recovery returns are calculated from the trough price in each crisis.
Across the three major market crises, gold has shown a remarkably consistent pattern. From the lows, it delivered an average 3-year return of about +100.9% — effectively doubling in value within three years of the trough.
What stands out is the sequence. The initial phase is almost always driven by liquidity stress or macro headwinds, which push gold lower alongside other assets. But once that pressure eases, the recovery tends to be far more powerful, often more than offsetting the earlier drawdown.
For investors who stayed patient — or stepped in at those lows — the payoff has been significant, with substantial gains in most cases. Even the more muted recovery during Covid-19 (+32.0%) came off a much higher starting point, with gold already near record levels going into the crisis. In contrast, the other two episodes delivered substantially stronger rebounds of +125.1% and +145.6%.
The broader takeaway is hard to ignore: periods of stress that push gold lower have, more often than not, turned into compelling entry points over a medium-term horizon.
Risks and Assumptions related to Back-tested trading strategies
Disclaimer: Century Financial Consultancy LLC (CFC) is licensed and regulated by the Capital Market Authority (CMA) of the UAE under license numbers 20200000028 and 301044 to carry out the activities of Financial Products dealer, Trading Broker in international markets, Trading Broker of OTC derivatives and currencies in the spot market, Introduction, Financial Consultations, and Promotion. CFC is incorporated under UAE law, registered with the Dubai Economic Department (No. 768189), with its office at 601, Level 6, Building No. 4, Emaar Square, Downtown Dubai, UAE, PO Box 65777.
Terms and Conditions of Access
By accessing and continuing to use the Publication (which includes this document, flyer, charts, diagrams, illustrations, images, calculations, scenario analysis, and related data or content), you confirm that you have read, understood, and agreed to the terms of this Disclaimer.
CFC reserves the right to amend or update the Publication and this Disclaimer at any time without prior notice. Continued use following any such update constitutes your acceptance of the revised terms. If you do not agree with these terms, please discontinue use of the Publication.
Purpose and Intended Use
This Publication is classified as marketing material and should not be regarded as independent investment research. It is provided for informational, educational, and illustrative purposes only and does not constitute investment advice, a recommendation, an offer, or a solicitation to buy or sell any financial instruments or services. All views expressed are general market commentary and may not reflect the opinions of CFC as a whole.
Risk Disclosures and Limitations
The information presented does not cover all the risks associated with the products or scenarios discussed. Please refer to the full Risk Disclosure Statement available on our website.
This Publication reflects information available at the time of preparation and does not account for subsequent developments. Any forward-looking statements involve assumptions and uncertainties; actual outcomes may differ materially. CFC does not guarantee the accuracy, completeness, or reliability of the information and disclaims liability for any action taken based on it.
No Offer or Contractual Commitment
No part of this Publication constitutes an offer, agreement, or commitment to enter into any transaction. Distribution of this Publication does not oblige CFC to engage in any trade or provide any services. Product names or terms may differ across platforms or providers. This material should not be interpreted as legal, regulatory, tax, accounting, or credit advice. Recipients should seek independent professional advice and assess their own financial situation, objectives, and risk profile before making investment decisions.
Data Sources and Interpretation
This Publication may rely on publicly available data, third-party information, or model-based assumptions. CFC makes no representation or warranty as to their accuracy or completeness. Data limitations, errors, or outdated inputs may impact the reliability of projections or scenarios. Names of financial products may differ from those used on trading platforms.
Use, Reproduction, and Analyst Disclosure
This Publication is intended solely for the recipient's informational use. It may not be copied, transmitted, or distributed in any form, wholly or partially, without prior written permission from CFC.
Analyst Declaration: The Analyst(s) certifies that all opinions expressed in this Publication represent their own independent views and that reasonable care was taken to ensure objectivity. They do not hold securities in the companies mentioned, and their compensation is not linked to the views expressed. CFC's research and marketing divisions operate independently.
Trading Risk Warning:
Trading in financial products involves significant risk. Leveraged OTC derivatives, such as Contracts for Difference (CFDs) and spot forex contracts, carry a high risk of loss that can potentially exceed initial deposits and may not be suitable for all investors. These instruments do not confer ownership of underlying assets. Investors must carefully evaluate their investment objectives and risk tolerance, and consult independent advisors where appropriate.


Regulated by CMA
Century Financial Consultancy LLC


.png)
.png)
.png)
.png)
.png)

Reach us:
-
Dubai
6th Floor, Emaar Square Building 4,
Downtown, Dubai, P.O. Box 65777,
Dubai, United Arab Emirates -
Abu Dhabi
27th Floor, Office 2701,
Shining Towers, Abu Dhabi, UAE -
Sharjah
29th Floor, Office 2905,
The Business Tower, Sharjah, UAE - +971 (4) 356 2800
- info@century.ae

Disclaimer: Trading in financial products carries substantial risk. Leveraged over-the-counter (OTC) derivatives, such as Contracts for Difference (CFDs) and spot forex, may result in losses exceeding initial deposits and may not be suitable for all investors. These complex instruments do not confer ownership of the underlying assets. Investors should carefully consider their investment objectives and risk appetite, and seek independent professional advice if necessary.
Century Financial Consultancy LLC (CFC) is licensed and regulated by the Capital Market Authority (CMA) of the UAE under license numbers 20200000028 and 301044 to carry out the activities of Financial Products dealer, Trading Broker in international markets, Trading Broker of OTC derivatives and currencies in the spot market, Introduction, Financial Consultations, and Promotion. CFC is incorporated under UAE law, registered with the Dubai Economic Department (No. 768189), with its office at 601, Level 6, Building No. 4, Emaar Square, Downtown Dubai, UAE, PO Box 65777.
The content on this website is provided solely for informational and educational purposes and does not constitute an offer, recommendation, or solicitation to buy or sell any securities or financial products.
Products and services offered by CFC are not intended for use in any jurisdiction where such use or distribution would breach local laws or regulatory requirements.
⚠️ Alert: Fraudulent Activity Notice
Century Financial Consultancy LLC (“Century”) has become aware of fraudulent individuals and entities impersonating our firm through unofficial websites, social media channels, and messaging applications such as Telegram, WhatsApp, and Discord.
Please be advised:
- Century does not manage investments on behalf of clients.
- Century does not solicit funds or guarantee investment returns.
- Century does not accept or make payments in cash, cryptocurrency, or digital assets.
- We do not conduct business via social media or messaging platforms.
Our only official website is www.century.ae, and all communication is conducted exclusively through verified channels.
We strongly urge the public to remain vigilant, verify the authenticity of any communication claiming to be from Century, and report any suspicious activity. Century disclaims any responsibility for losses arising from dealings with unauthorised or fraudulent parties.
