Friday, April 17, 2026
Silver’s Next Big Move - Correction Builds Opportunity
By Century Financial in 'Investment Insights'

.jpg)
Brief Overview
Silver emerged as one of the most powerful performers in the global commodity complex in 2025. Prices surged sharply across domestic and global markets, supported by a rare combination of macroeconomic uncertainty, supply disruptions, strong investment flows, and industrial demand. However, silver experienced a steep and rapid correction, falling 37% from its March 2 peak of $97.30 to a low of $61 by March 23, marking one of the most aggressive short-term declines in recent years.
The selloff was driven by a confluence of factors, including volatile geopolitical headlines, a sharp rise in energy prices, and a rebound in the U.S. Dollar toward the crucial 100 level. An unexpectedly hawkish shift in FOMC expectations also added to the fall.
Market expectations for two rate cuts in September and December were completely unwound, with the market instead flipping to a 20% probability of a 25-basis-point rate hike. This repricing pushed 10-year US Treasury yields higher, reaching 4.44%.
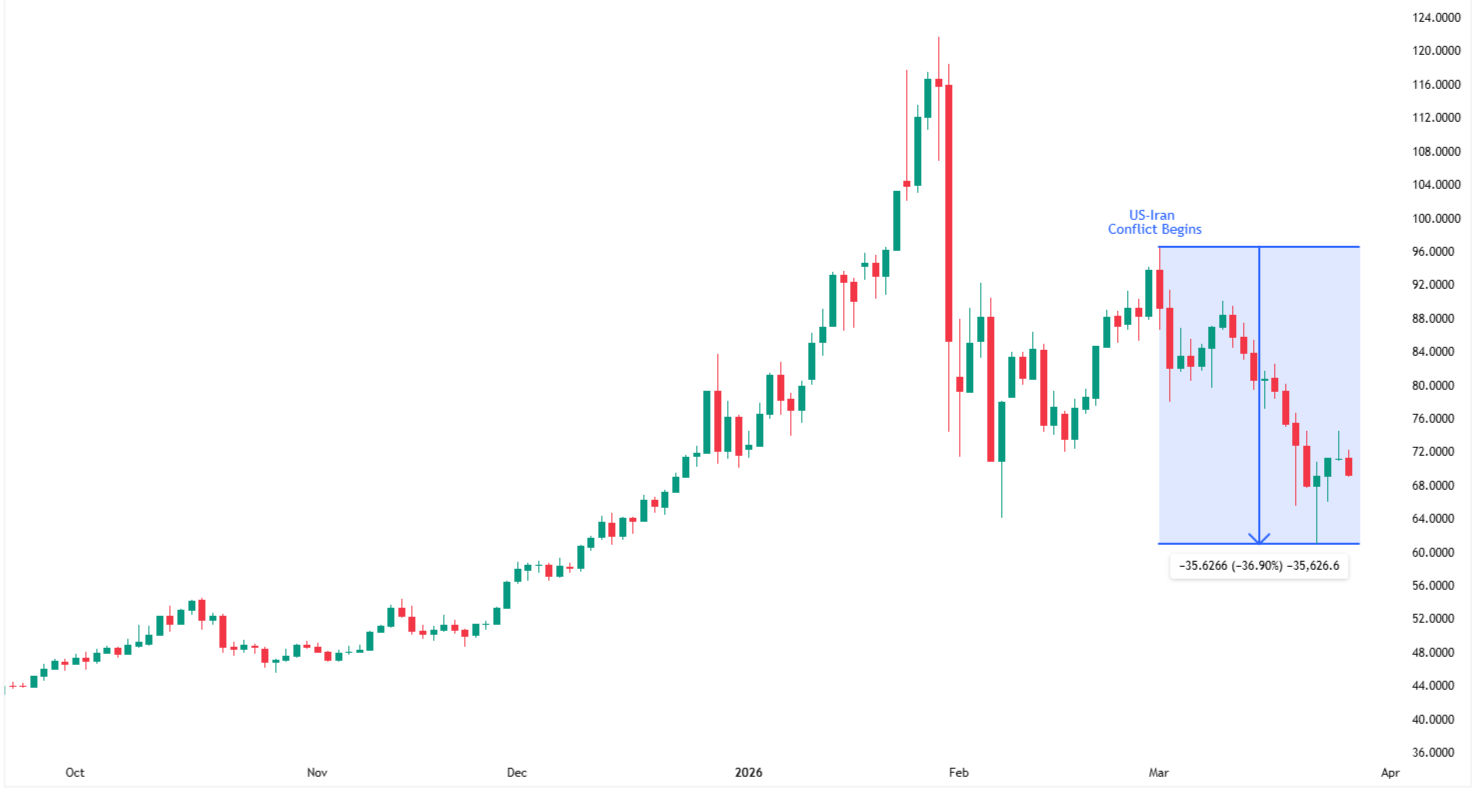
Source: TradingView
Date: 26 March 2026
What the market may be overlooking is that silver’s structural demand story remains firmly intact. Historically, post-conflict environments have supported strong rebounds - silver, for instance, rallied over 20% in the six months following the end of the Gulf War in 1991.
Macro-driven reset in silver lays the groundwork for a more sustainable uptrend.
Investment Thesis
1. Industrial Demand Is Structural, Not Cyclical
The current selloff in silver is not a fundamental re-rating. Silver's demand base spans solar PV, EVs, AI data centres, and power grid infrastructure. All of them are long-duration, policy-backed demand streams. The current conflict-driven oil price increases will accelerate the transition to renewables and EVs, especially across Asia, in pursuit of energy independence. Price weakness is an entry opportunity, not a structural shift.
67 Moz supply deficit in 2026
(sixth consecutive year)
Next-gen TOPCon solar cells consume 50% more silver than legacy cells
94 Moz, 3.4% CAGR
(Automotive silver demand forecast by 2031)
2. De-escalation (even partial) would unlock a sharp post-conflict recovery trade
A ceasefire or diplomatic breakthrough would simultaneously ease energy prices, restore risk appetite, and revive Gulf manufacturing capex. This is all silver-positive. The 1991 Gulf War precedent shows that silver rallied by 20%+ within 6 months of conflict resolution. Crucially, COT data shows large speculator net longs have flipped to net short. This is the kind of washed-out positioning that historically precedes explosive short-covering rallies. Current pricing implies no resolution premium whatsoever.
3. China's Industrial Silver Imports Hit a Multi-Year High
China has aggressively tightened the global silver market in early 2026, importing over 790 tonnes in just January and February, including a record ~470 tonnes in February alone, pushing purchases to an eight-year high. This surge is being driven by both solar manufacturing and retail investment. It has lifted domestic prices above global benchmarks and drained already low exchange inventories, amplifying supply tightness.
790 tonnes China silver imports, Jan–Feb 2026
8-year high
Monthly import level
Export controls
Official approval required for outbound silver
4. Revival in the ETF Positioning
After shedding 56.6 Moz YTD, silver ETFs recorded a +7.3 Moz single-session inflow — one of the largest discrete accumulation events of 2026. Physical investment is forecast to rise 20% in 2026 to a three-year high of 227 Moz, led by a recovery in Western retail investment.
TECHNICAL ANALYSIS
.png)
Source: TradingView
Date: 26 March 2026
Silver has recently corrected sharply after its strong rally to the highs near $120, and the pullback has now brought the price into a very important Fibonacci retracement zone. Currently, silver is taking support around the 0.618 level, which falls near $65, a level widely considered the “golden ratio” and often a strong demand zone in trending markets. This level is particularly significant because it also aligns with prior consolidation and breakout areas, strengthening its role as support. Recent price action shows stabilisation around this zone, with buyers stepping in and suggesting that selling pressure is being absorbed. At the moment of writing, silver is trading around $69, slightly above this key support, indicating a potential early bounce. As long as silver holds above this 0.618 level, the broader uptrend structure remains intact, and this area could act as a base for a move higher. On the upside, key levels to watch are around $75 (0.5 retracement), then $86 (0.382), and finally $99 (0.236), which would signal stronger bullish continuation if reclaimed. However, if silver fails to hold this level and breaks decisively below $65, it could trigger a deeper correction toward the next support around $48 (0.786 retracement).
Risks and Assumptions related to Back-tested trading strategies
Disclaimer: Century Financial Consultancy LLC (CFC) is licensed and regulated by the Capital Market Authority (CMA) of the UAE under license numbers 20200000028 and 301044 to carry out the activities of Financial Products dealer, Trading Broker in international markets, Trading Broker of OTC derivatives and currencies in the spot market, Introduction, Financial Consultations, and Promotion. CFC is incorporated under UAE law, registered with the Dubai Economic Department (No. 768189), with its office at 601, Level 6, Building No. 4, Emaar Square, Downtown Dubai, UAE, PO Box 65777.
Terms and Conditions of Access
By accessing and continuing to use the Publication (which includes this document, flyer, charts, diagrams, illustrations, images, calculations, scenario analysis, and related data or content), you confirm that you have read, understood, and agreed to the terms of this Disclaimer.
CFC reserves the right to amend or update the Publication and this Disclaimer at any time without prior notice. Continued use following any such update constitutes your acceptance of the revised terms. If you do not agree with these terms, please discontinue use of the Publication.
Purpose and Intended Use
This Publication is classified as marketing material and should not be regarded as independent investment research. It is provided for informational, educational, and illustrative purposes only and does not constitute investment advice, a recommendation, an offer, or a solicitation to buy or sell any financial instruments or services. All views expressed are general market commentary and may not reflect the opinions of CFC as a whole.
Risk Disclosures and Limitations
The information presented does not cover all the risks associated with the products or scenarios discussed. Please refer to the full Risk Disclosure Statement available on our website.
This Publication reflects information available at the time of preparation and does not account for subsequent developments. Any forward-looking statements involve assumptions and uncertainties; actual outcomes may differ materially. CFC does not guarantee the accuracy, completeness, or reliability of the information and disclaims liability for any action taken based on it.
No Offer or Contractual Commitment
No part of this Publication constitutes an offer, agreement, or commitment to enter into any transaction. Distribution of this Publication does not oblige CFC to engage in any trade or provide any services. Product names or terms may differ across platforms or providers. This material should not be interpreted as legal, regulatory, tax, accounting, or credit advice. Recipients should seek independent professional advice and assess their own financial situation, objectives, and risk profile before making investment decisions.
Data Sources and Interpretation
This Publication may rely on publicly available data, third-party information, or model-based assumptions. CFC makes no representation or warranty as to their accuracy or completeness. Data limitations, errors, or outdated inputs may impact the reliability of projections or scenarios. Names of financial products may differ from those used on trading platforms.
Use, Reproduction, and Analyst Disclosure
This Publication is intended solely for the recipient’s informational use. It may not be copied, transmitted, or distributed in any form, wholly or partially, without prior written permission from CFC.
Analyst Declaration: The Analyst(s) certifies that all opinions expressed in this Publication represent their own independent views and that reasonable care was taken to ensure objectivity. They do not hold securities in the companies mentioned, and their compensation is not linked to the views expressed. CFC’s research and marketing divisions operate independently.
Trading Risk Warning:
Trading in financial products involves significant risk. Leveraged OTC derivatives, such as Contracts for Difference (CFDs) and spot forex contracts, carry a high risk of loss that can potentially exceed initial deposits and may not be suitable for all investors. These instruments do not confer ownership of underlying assets. Investors must carefully evaluate their investment objectives and risk tolerance, and consult independent advisors where appropriate.


Regulated by CMA
Century Financial Consultancy LLC


.png)
.png)
.png)
.png)
.png)

Reach us:
-
Dubai
6th Floor, Emaar Square Building 4,
Downtown, Dubai, P.O. Box 65777,
Dubai, United Arab Emirates -
Abu Dhabi
27th Floor, Office 2701,
Shining Towers, Abu Dhabi, UAE -
Sharjah
29th Floor, Office 2905,
The Business Tower, Sharjah, UAE - +971 (4) 356 2800
- info@century.ae

Disclaimer: Trading in financial products carries substantial risk. Leveraged over-the-counter (OTC) derivatives, such as Contracts for Difference (CFDs) and spot forex, may result in losses exceeding initial deposits and may not be suitable for all investors. These complex instruments do not confer ownership of the underlying assets. Investors should carefully consider their investment objectives and risk appetite, and seek independent professional advice if necessary.
Century Financial Consultancy LLC (CFC) is licensed and regulated by the Capital Market Authority (CMA) of the UAE under license numbers 20200000028 and 301044 to carry out the activities of Financial Products dealer, Trading Broker in international markets, Trading Broker of OTC derivatives and currencies in the spot market, Introduction, Financial Consultations, and Promotion. CFC is incorporated under UAE law, registered with the Dubai Economic Department (No. 768189), with its office at 601, Level 6, Building No. 4, Emaar Square, Downtown Dubai, UAE, PO Box 65777.
The content on this website is provided solely for informational and educational purposes and does not constitute an offer, recommendation, or solicitation to buy or sell any securities or financial products.
Products and services offered by CFC are not intended for use in any jurisdiction where such use or distribution would breach local laws or regulatory requirements.
⚠️ Alert: Fraudulent Activity Notice
Century Financial Consultancy LLC (“Century”) has become aware of fraudulent individuals and entities impersonating our firm through unofficial websites, social media channels, and messaging applications such as Telegram, WhatsApp, and Discord.
Please be advised:
- Century does not manage investments on behalf of clients.
- Century does not solicit funds or guarantee investment returns.
- Century does not accept or make payments in cash, cryptocurrency, or digital assets.
- We do not conduct business via social media or messaging platforms.
Our only official website is www.century.ae, and all communication is conducted exclusively through verified channels.
We strongly urge the public to remain vigilant, verify the authenticity of any communication claiming to be from Century, and report any suspicious activity. Century disclaims any responsibility for losses arising from dealings with unauthorised or fraudulent parties.
