Thursday, April 16, 2026
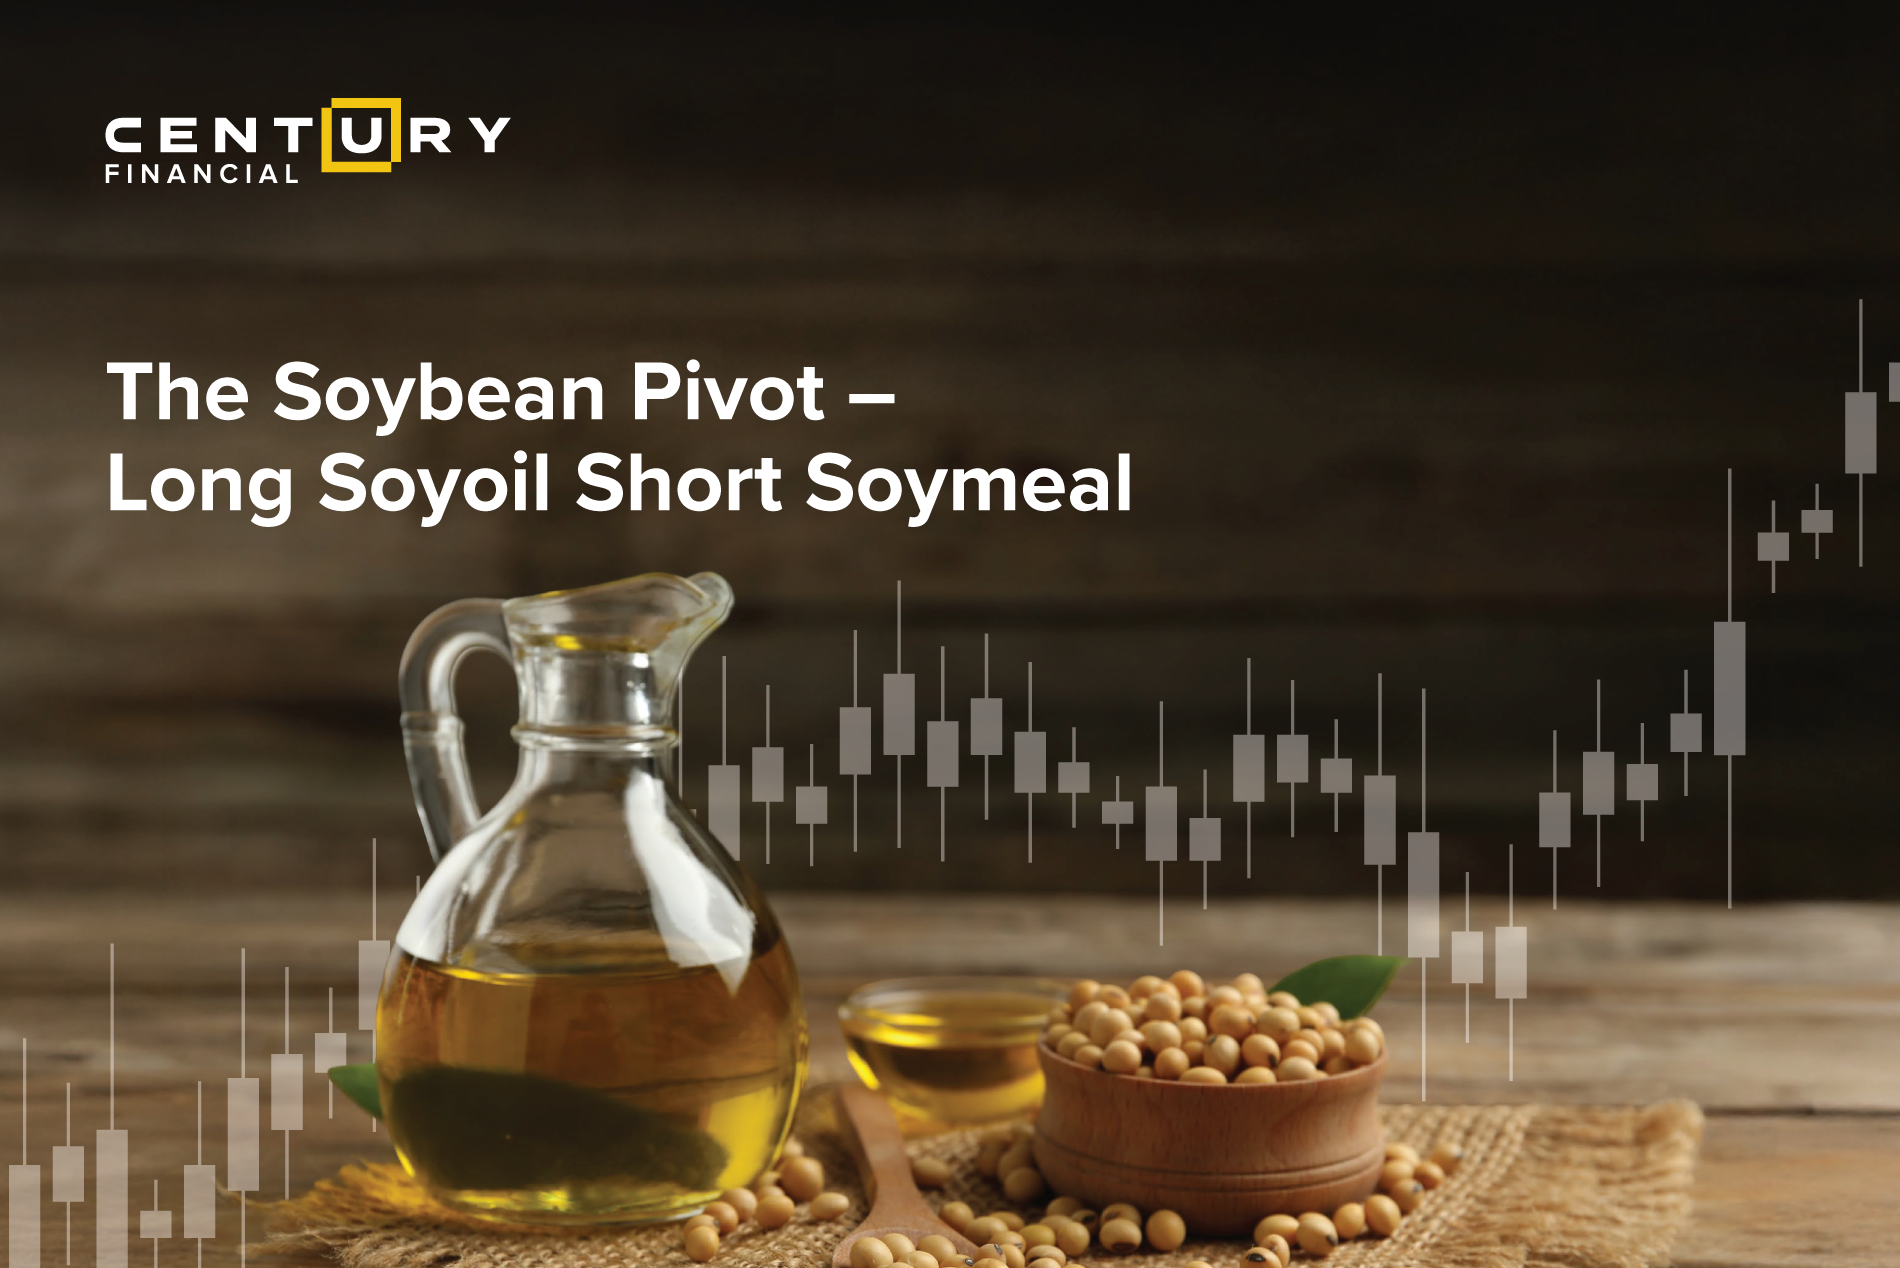
The Soybean Pivot – Long Soyoil Short Soymeal
By Century Financial in 'Investment Insights'
.png)
In Simple Terms
The US government’s biofuels mandates are forcing a sharp rise in usage of biofuel, and domestic production cannot keep pace. The ongoing geopolitical crisis adds a near-term price boost.
Furthermore, according to the mandate, 78% of all US soy oil to be used for fuel production.
Demand for Soyoil is expected to be at 18.5 billion pounds, while the supply is expected to be at 16 billion pounds. Causing an undersupply of 2.5 billion pounds.
Long Soybean Oil
US soy oil faces a demand-supply gap in 2026-27. Government biofuels mandates are forcing a sharp rise in demand, a key competing import has been eliminated by policy, and domestic production cannot keep pace.
Biodiesel in the United States is a renewable, biodegradable fuel produced primarily from soybean oil, used cooking oil, and animal fats.
Compliance-Driven, Not Discretionary
The EPA's biofuel mandate for 2026-27 requires 78% of all US soy oil to be used for fuel production, up from 48% in 2024. This is legally compelled consumption — US refiners must comply or face penalties. The final rule was submitted for approval in late February and is expected in late March.
Even running every US crush plant at full capacity, domestic soy oil production in 2026 tops out at ~30.1 billion pounds. After food and feed use (~14 billion pounds), only ~16 billion pounds remain, roughly 2.5 billion pounds short of what renewable diesel requires. New plants coming online oer marginal relief, not a fix.
Chinese UCO Effectively Banned
China supplied 5.4 billion pounds of used cooking oil (UCO) to US renewable diesel producers in 2024, up from just 285 million pounds in 2021. The 2026 amendment to the 45Z tax credit restricts biofuel incentives to North American-origin feedstocks, eectively eliminating Chinese UCO from the programme. That displaced volume has no scalable domestic substitute other than soy oil.
Near-Term Catalyst: Geopolitical Energy Premium
US-Israel strikes on Iran have pushed Brent crude to approximately $100/barrel, with the Strait of Hormuz remaining disrupted. Soy oil has tracked crude prices closely, gaining approximately 8% in March 2026 alone, revisiting levels last seen in 2023. Market participants are pricing soy oil as an energy proxy. The duration of this premium is contingent on the conflict trajectory.
Short Soybean Meal
Soybean crushing is the industrial process of extracting oil from soybeans, which leads to the production of two primary products: soybean oil and soybean meal.
The process separates the soybean into roughly 80% meal (used for animal feed) and 20% oil (used for food and biofuel). Meaning that if 30 billion pounds of soyoil is produced, then approximately 120 billion pounds of soymeal is produced. Looking at the demand, the US demand is expected to be at 42.4 million short tons, or about 85 billion pounds.
This shows a supply glut in the commodity.
Ratio Chart
.png)
Source: TradingView
Date: 25 March 2026
The ratio between soyoil and soymeal had resistance at the 0.20 mark on the monthly chart. In the weekly chart, it has broken this resistance and has even bounced after retesting the same.
Risks and Assumptions related to Back-tested trading strategies
Disclaimer: Century Financial Consultancy LLC (CFC) is licensed and regulated by the Capital Market Authority (CMA) of the UAE under license numbers 20200000028 and 301044 to carry out the activities of Financial Products dealer, Trading Broker in international markets, Trading Broker of OTC derivatives and currencies in the spot market, Introduction, Financial Consultations, and Promotion. CFC is incorporated under UAE law, registered with the Dubai Economic Department (No. 768189), with its office at 601, Level 6, Building No. 4, Emaar Square, Downtown Dubai, UAE, PO Box 65777.
Terms and Conditions of Access
By accessing and continuing to use the Publication (which includes this document, flyer, charts, diagrams, illustrations, images, calculations, scenario analysis, and related data or content), you confirm that you have read, understood, and agreed to the terms of this Disclaimer.
CFC reserves the right to amend or update the Publication and this Disclaimer at any time without prior notice. Continued use following any such update constitutes your acceptance of the revised terms. If you do not agree with these terms, please discontinue use of the Publication.
Purpose and Intended Use
This Publication is classified as marketing material and should not be regarded as independent investment research. It is provided for informational, educational, and illustrative purposes only and does not constitute investment advice, a recommendation, an offer, or a solicitation to buy or sell any financial instruments or services. All views expressed are general market commentary and may not reflect the opinions of CFC as a whole.
Risk Disclosures and Limitations
The information presented does not cover all the risks associated with the products or scenarios discussed. Please refer to the full Risk Disclosure Statement available on our website.
This Publication reflects information available at the time of preparation and does not account for subsequent developments. Any forward-looking statements involve assumptions and uncertainties; actual outcomes may differ materially. CFC does not guarantee the accuracy, completeness, or reliability of the information and disclaims liability for any action taken based on it.
No Offer or Contractual Commitment
No part of this Publication constitutes an offer, agreement, or commitment to enter into any transaction. Distribution of this Publication does not oblige CFC to engage in any trade or provide any services. Product names or terms may differ across platforms or providers. This material should not be interpreted as legal, regulatory, tax, accounting, or credit advice. Recipients should seek independent professional advice and assess their own financial situation, objectives, and risk profile before making investment decisions.
Data Sources and Interpretation
This Publication may rely on publicly available data, third-party information, or model-based assumptions. CFC makes no representation or warranty as to their accuracy or completeness. Data limitations, errors, or outdated inputs may impact the reliability of projections or scenarios. Names of financial products may differ from those used on trading platforms.
Use, Reproduction, and Analyst Disclosure
This Publication is intended solely for the recipient’s informational use. It may not be copied, transmitted, or distributed in any form, wholly or partially, without prior written permission from CFC.
Analyst Declaration: The Analyst(s) certifies that all opinions expressed in this Publication represent their own independent views and that reasonable care was taken to ensure objectivity. They do not hold securities in the companies mentioned, and their compensation is not linked to the views expressed. CFC’s research and marketing divisions operate independently.
Trading Risk Warning:
Trading in financial products involves significant risk. Leveraged OTC derivatives, such as Contracts for Difference (CFDs) and spot forex contracts, carry a high risk of loss that can potentially exceed initial deposits and may not be suitable for all investors. These instruments do not confer ownership of underlying assets. Investors must carefully evaluate their investment objectives and risk tolerance, and consult independent advisors where appropriate.


Regulated by CMA
Century Financial Consultancy LLC


.png)
.png)
.png)
.png)
.png)

Reach us:
-
Dubai
6th Floor, Emaar Square Building 4,
Downtown, Dubai, P.O. Box 65777,
Dubai, United Arab Emirates -
Abu Dhabi
27th Floor, Office 2701,
Shining Towers, Abu Dhabi, UAE -
Sharjah
29th Floor, Office 2905,
The Business Tower, Sharjah, UAE - +971 (4) 356 2800
- info@century.ae

Disclaimer: Trading in financial products carries substantial risk. Leveraged over-the-counter (OTC) derivatives, such as Contracts for Difference (CFDs) and spot forex, may result in losses exceeding initial deposits and may not be suitable for all investors. These complex instruments do not confer ownership of the underlying assets. Investors should carefully consider their investment objectives and risk appetite, and seek independent professional advice if necessary.
Century Financial Consultancy LLC (CFC) is licensed and regulated by the Capital Market Authority (CMA) of the UAE under license numbers 20200000028 and 301044 to carry out the activities of Financial Products dealer, Trading Broker in international markets, Trading Broker of OTC derivatives and currencies in the spot market, Introduction, Financial Consultations, and Promotion. CFC is incorporated under UAE law, registered with the Dubai Economic Department (No. 768189), with its office at 601, Level 6, Building No. 4, Emaar Square, Downtown Dubai, UAE, PO Box 65777.
The content on this website is provided solely for informational and educational purposes and does not constitute an offer, recommendation, or solicitation to buy or sell any securities or financial products.
Products and services offered by CFC are not intended for use in any jurisdiction where such use or distribution would breach local laws or regulatory requirements.
⚠️ Alert: Fraudulent Activity Notice
Century Financial Consultancy LLC (“Century”) has become aware of fraudulent individuals and entities impersonating our firm through unofficial websites, social media channels, and messaging applications such as Telegram, WhatsApp, and Discord.
Please be advised:
- Century does not manage investments on behalf of clients.
- Century does not solicit funds or guarantee investment returns.
- Century does not accept or make payments in cash, cryptocurrency, or digital assets.
- We do not conduct business via social media or messaging platforms.
Our only official website is www.century.ae, and all communication is conducted exclusively through verified channels.
We strongly urge the public to remain vigilant, verify the authenticity of any communication claiming to be from Century, and report any suspicious activity. Century disclaims any responsibility for losses arising from dealings with unauthorised or fraudulent parties.
