 Loading ...

Monday, September 21, 2026
The Energy Bottleneck: Gasoline WTI Pair Trade
تم إعداد هذا المنشور من قبل سنشري للاستشارات
__706859886.jpg)
.jpg)
Gasoline WTI Pair Trade
Long - Gasoline Cash / Short - WTI Crude Oil (Nov -26)
This trade isolates the U.S. Refining Margin (Crack Spread) while hedging out global absolute oil price direction. Combining a long finished-product exposure with a short raw-feedstock exposure anchors performance directly to refining capacity bottlenecks, rather than relying on crude prices remaining high.
Rationale:
Gasoline remains supported by a combination of very high crude prices, disrupted global refining capacity and tight refined-product supply. Brent is back above $107 per barrel and WTI above $102 per barrel as attacks on Saudi infrastructure and disruption around the Red Sea continue to threaten crude and product flows. The key point for gasoline is that this is no longer simply a crude-oil story. Refining capacity itself is becoming the bottleneck.
What’s driving the rise?
1. Tight global refined-product supply
The Middle East conflict has severely disrupted global refined-product flows, with the impact becoming increasingly visible in refinery output and inventories. Global refinery throughput stood at 81.4 million bpd in August, 4.2 million bpd below the same month last year, with losses spread across the Middle East, Russia, and crude-importing economies in Asia. The IEA expects full-year refinery runs to decline by 2.6 million bpd in 2026. More importantly, refined-product and LPG exports from Gulf countries remain nearly 60%, or 3.7 million bpd, below February levels. Gulf diesel and gasoil exports averaged just 390,000 bpd in August, slightly above one-quarter of pre-war levels, while combined Gulf and Russian diesel/gasoil exports were 1.6 million bpd below February levels.
This supply shock has also rapidly drawn down inventories, with global observed oil stocks falling by 95 million barrels in August alone and 507 million barrels since February. With global refining capacity already stretched, the disruption in refined-product supply is keeping product markets significantly tighter than the underlying crude market.
2. Strong refining margins
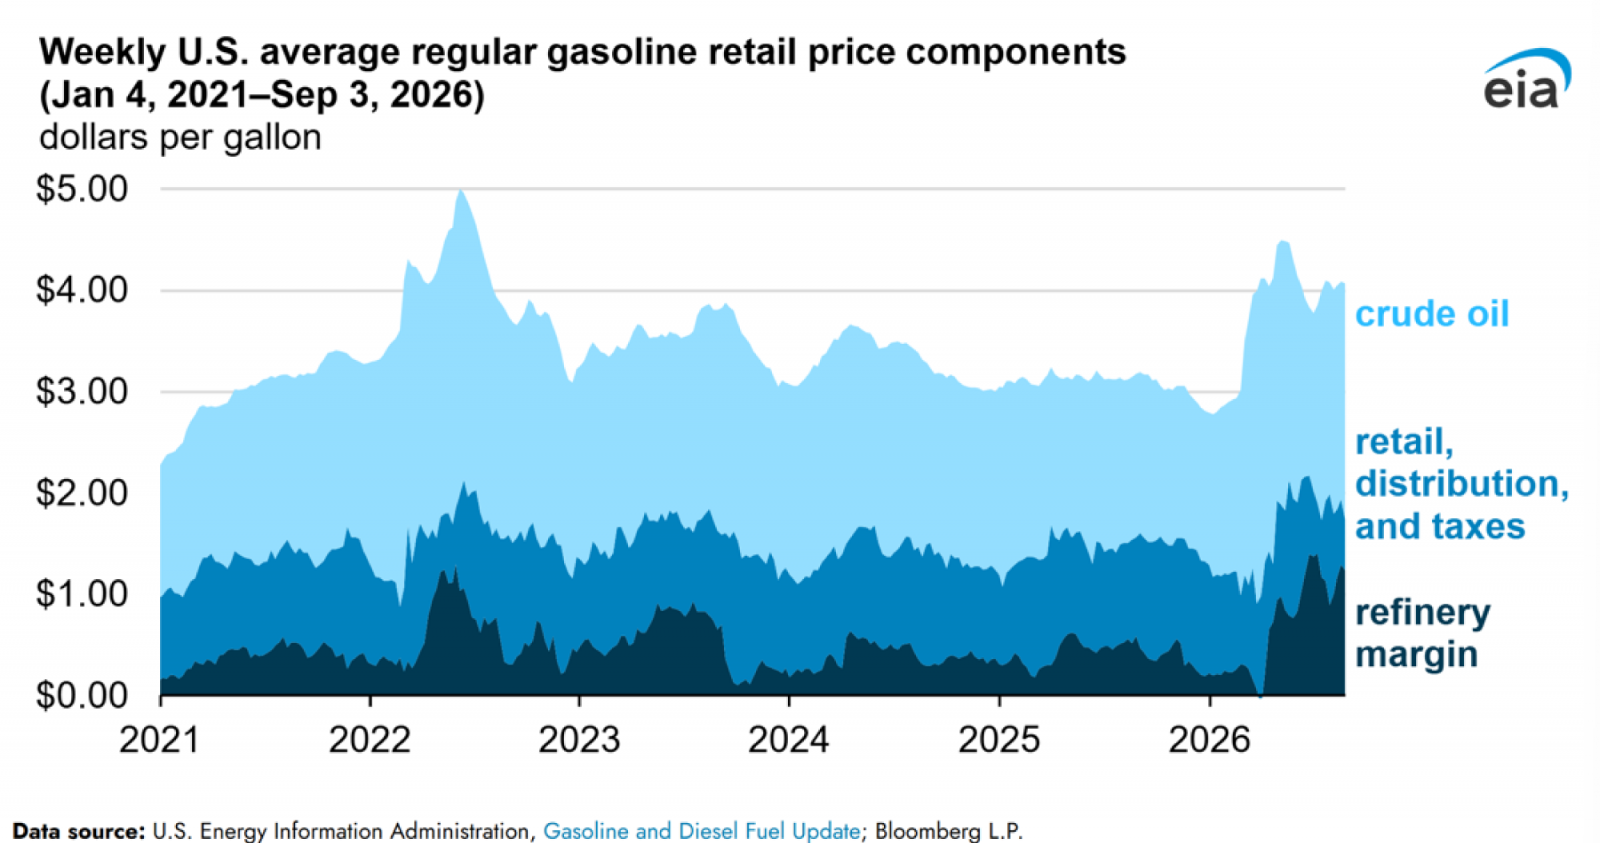
Crack spreads are indicators of the profitability of refining crude oil into petroleum products such as gasoline and diesel. One common crack spread is calculated by subtracting the spot market price of a gallon of crude oil from the wholesale price of a gallon of refined product.
Since May, the crack spread for gasoline in New York Harbor has been about 1 cent per gallon (gal) higher than it was in 2025, when the crack spread reached about 60 cents per gallon. The crack spread for gasoline is still high because refiners are having difficulty in replacing the barrels they have lost. Gasoline supplies are scarce due to disruptions to refining operations around the world in Russia, China, and the Middle East.
Tighter global supplies and higher prices have increased both the cost of imported gasoline and demand for gasoline exports from the United States. Since March, total U.S. imports of gasoline, including finished gasoline and blending components, have been 32% below the five-year (2021–2025) average.
EIA noted that elevated crack spreads, together with higher crude prices, have been a major contributor to higher gasoline prices. European gasoline margins recently rose above $62 per barrel, close to the 2022 record, while ARA gasoline inventories fell to their lowest level since 2021.
3. Middle East supply risks remain unusually high
Saudi oil production had already dropped sharply after tensions rose in March when the Strait of Hormuz was closed, and recent attacks on the East-West pipeline threaten another serious disruption. Since the pipeline usually transports about 7 million barrels per day, a long-lasting shutdown could seriously reduce the supply of crude oil and products.
4. Gasoline inventories are not particularly comfortable
U.S. gasoline inventories increased by around 1.3 million barrels in the latest week to 206.9 million barrels, but gasoline demand simultaneously fell to 8.6mbpd. The inventory build is therefore a near-term bearish factor, although it is being offset by the much larger global supply disruption.
Although the overall outlook for gasoline remains tilted toward the bullish side, it may become increasingly vulnerable to a sharp correction if Middle East shipping flows, Saudi production, or refinery availability meaningfully improve. Also, sustained $100+ crude prices will eventually start destroying demand. OPEC has already cut its 2026 global oil-demand growth forecast to just 380,000 bpd, its fifth consecutive downward revision.
Even if a peace deal happens between the US and Iran or Saudi Arabia and Yemen, prices for refined products like gasoline may be stickier than WTI, making this spread idea viable in such macroeconomic conditions.
Gasoline Technical Outlook
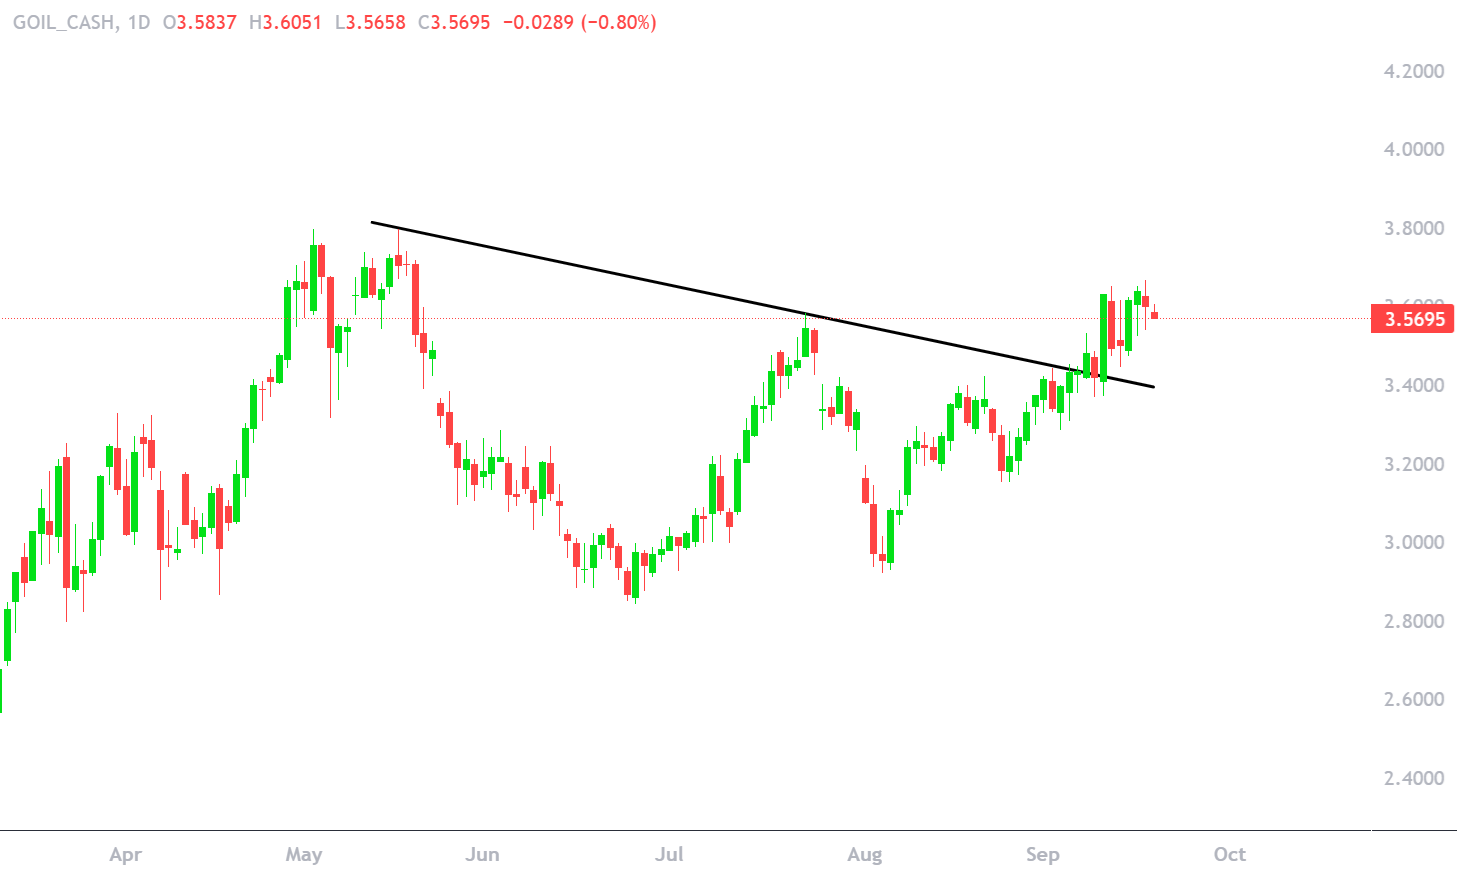
Gasoline appears to have broken out of a downward-sloping trendline connecting the highs of 18th May near $3.79 and 23rd July near $3.58, suggesting a short-term bullish outlook on the daily chart. With the daily RSI also trading above the 50-mark, momentum seems tilted toward the upside.
The previous highs around $3.65 from September 11th remain key near-term resistance to clear before further buying momentum could test the $3.79 levels from mid-May. On the downside, the 50-day EMA near $3.32 could provide crucial support if the $3.40 level from the downward-sloping trendline breaks.
Gasoline/WTI Ratio
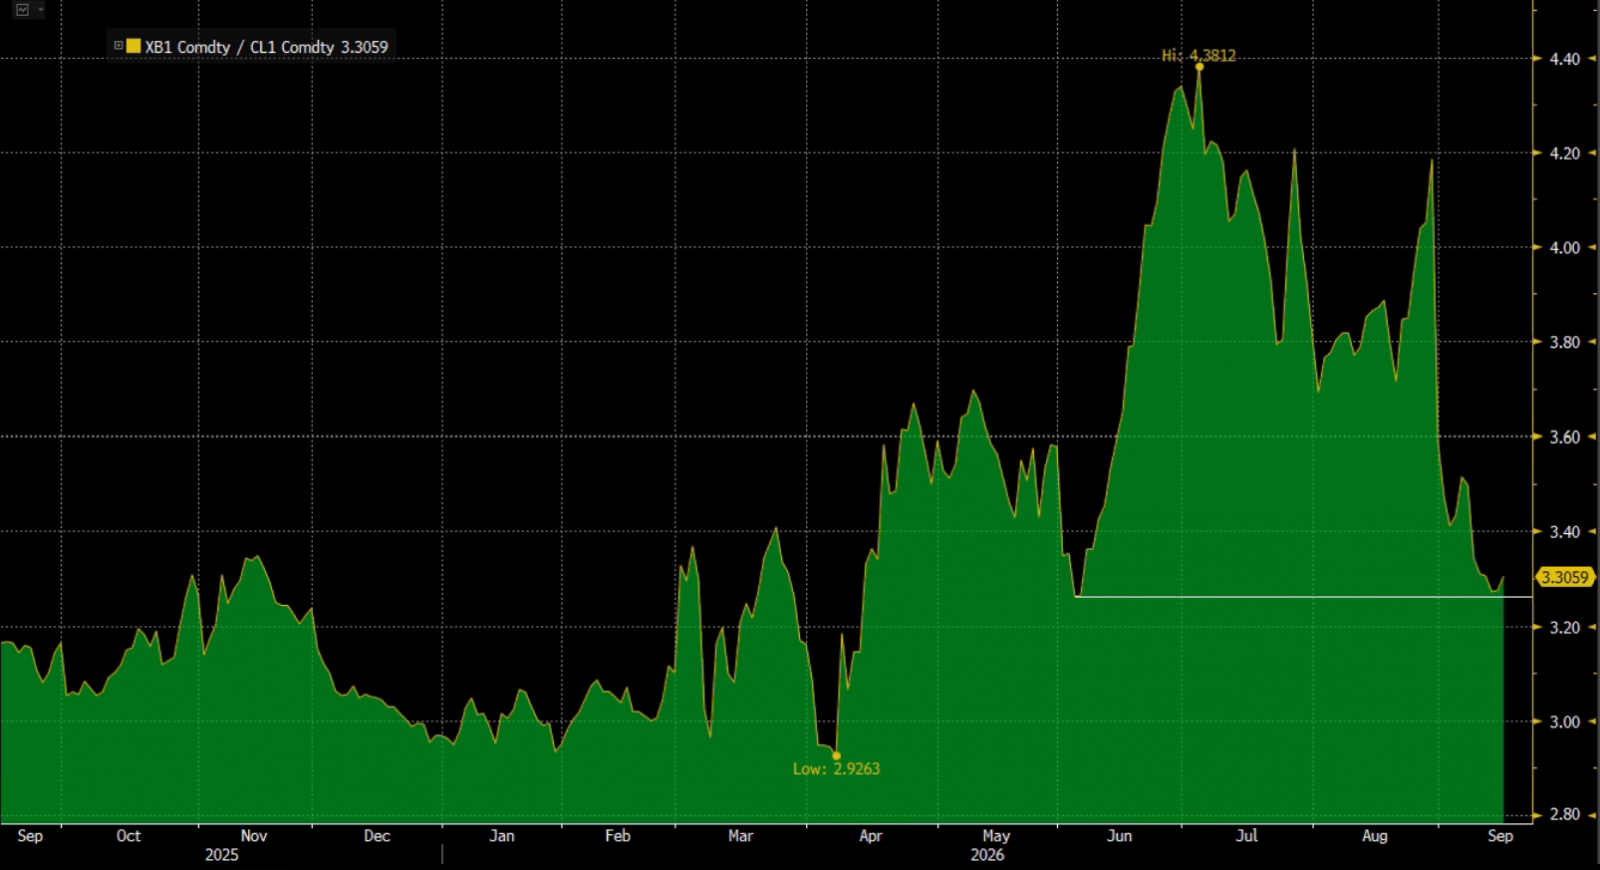
The Gasoline/WTI ratio is currently rising after respecting a pivotal horizontal support line near 3.26 levels from the lows of 3rd June (demarcated by the bright white line on the chart). If buyers step in to defend this zone, the technical strength of this support will be valid, suggesting a key inflection point from a pair-trading perspective
Scenario Analysis
The following table shows potential profit and loss scenarios for a Long Gasoline / Short WTI Crude Oil pair trade. The trade uses an Equal Cash Exposure strategy with $100,000 allocated per leg, for a combined gross exposure of $200,000.
The model tracks a current baseline price ratio of 0.037 based on current spot levels of Gasoline at $3.57 per gallon and WTI (November 2026 contract) at $95.29 per barrel.
| Scenario Analysis for when Ratio Increases | ||||||||
|---|---|---|---|---|---|---|---|---|
| Position | Index | Exposure Amount | Number of Units | Current Price when Ratio is 0.037 |
Ratio increases to 0.041 | Ratio increases to 0.043 | ||
| Price* | Potential Profit in USD | Price* | Potential Profit in USD | |||||
| Long | Gasoline - Cash | $100,000 | 27988 | $3.57 | $3.93 | $10,000.00 | $4.29 | $20,000.00 |
| Short | WTI - Nov 26 | $100,000 | 1049 | $95.29 | $96.48 | -$1,250.00 | $98.89 | -$3,781.25 |
| $200,000 | $8,750.00 | $16,218.75 | ||||||
| Expected Return (in %) | 4.38% | 8.11% | ||||||
| Scenario Analysis for when Ratio Decreases | ||||||||
|---|---|---|---|---|---|---|---|---|
| Position | Index | Exposure Amount | Number of Units | Current Price when Ratio is 0.037 |
Ratio decreases to 0.035 | Ratio decreases to 0.033 | ||
| Price* | Estimated Loss in USD | Price* | Estimated Loss in USD | |||||
| Long | Gasoline - Cash | $100,000 | 27988 | $3.57 | $3.27 | -$8,500.00 | $2.95 | -$17,500.00 |
| Short | WTI - Nov 26 | $100,000 | 1049 | $95.29 | $92.43 | $3,000.00 | $89.57 | $6,000.00 |
| $200,000 | -$5,500.00 | -$11,500.00 | ||||||
| Expected Return (in %) | -2.75% | -5.75% | ||||||
Date: 18th September, 2026
Source: Bloomberg
*Prices when ratio increases/decreases are hypothetical.
Note - The estimated profit/loss does not account for holding charges.
1. Ratio Increases (Bullish Spread Expansion)
This scenario simulates conditions where finished refined product (Gasoline) outpaces raw feedstock costs (WTI), representing an expansion of the refining crack spread.
- If the price ratio expands to 0.041, Gasoline rises to $3.93 (generating a $10,000 profit), while WTI rises more modestly to $96.48 (resulting in a -$1,250 short loss). This generates an expected return of 4.38% with a net combined profit of $8,750.
- If the ratio widens further to 0.043, Gasoline rallies to $4.29 (+$20,000 profit), while WTI ticks up to $98.89 (-$3,781.25 loss). This drives an expected return of 8.11% with a total net profit of $16,218.
2. Ratio Decreases (Bearish Spread Compression)
This scenario covers the structural risks where the spread compresses, either because raw crude spikes aggressively due to supply fears or because finished gasoline demand deteriorates.
- If the ratio drops to 0.035, the long Gasoline position drops to $3.27 (-$8,500 loss), while the short WTI contract declines to $92.43 (+$3,000 profit). This leads to an expected return of -2.75% with a combined net loss of -$5,500.
- A severe compression to 0.033 maps Gasoline down to $2.95 (-$17,500 loss) and WTI down to $89.57 (+$6,000 profit). This results in an expected return of -5.75% and an overall portfolio drawdown of -$11,500.
Risks and Assumptions related to Back-tested trading strategies
Disclaimer:Century Financial Consultancy LLC (CFC) is licensed and regulated by the Capital Market Authority (CMA) of the UAE under license numbers 20200000028 and 301044 to carry out the activities of Financial Products dealer, Trading Broker in international markets, Trading Broker of OTC derivatives and currencies in the spot market, Introduction, Financial Consultations, and Promotion. CFC is incorporated under UAE law, registered with the Dubai Economic Department (No. 768189), with its office at 601, Level 6, Building No. 4, Emaar Square, Downtown Dubai, UAE, PO Box 65777.
Terms and Conditions of Access
By accessing and continuing to use the Publication (which includes this document, flyer, charts, diagrams, illustrations, images, calculations, scenario analysis, and related data or content), you confirm that you have read, understood, and agreed to the terms of this Disclaimer.
CFC reserves the right to amend or update the Publication and this Disclaimer at any time without prior notice. Continued use following any such update constitutes your acceptance of the revised terms. If you do not agree with these terms, please discontinue use of the Publication.
Purpose and Intended Use
This Publication is classified as marketing material and should not be regarded as independent investment research. It is provided for informational, educational, and illustrative purposes only and does not constitute investment advice, a recommendation, an offer, or a solicitation to buy or sell any financial instruments or services. All views expressed are general market commentary and may not reflect the opinions of CFC as a whole.
Risk Disclosures and Limitations
The information presented does not cover all the risks associated with the products or scenarios discussed. Please refer to the full Risk Disclosure Statement available on our website.
This Publication reflects information available at the time of preparation and does not account for subsequent developments. Any forward-looking statements involve assumptions and uncertainties; actual outcomes may differ materially. CFC does not guarantee the accuracy, completeness, or reliability of the information and disclaims liability for any action taken based on it.
No Offer or Contractual Commitment
No part of this Publication constitutes an offer, agreement, or commitment to enter into any transaction. Distribution of this Publication does not oblige CFC to engage in any trade or provide any services. Product names or terms may differ across platforms or providers. This material should not be interpreted as legal, regulatory, tax, accounting, or credit advice. Recipients should seek independent professional advice and assess their own financial situation, objectives, and risk profile before making investment decisions.
Data Sources and Interpretation
This Publication may rely on publicly available data, third-party information, or model-based assumptions. CFC makes no representation or warranty as to their accuracy or completeness. Data limitations, errors, or outdated inputs may impact the reliability of projections or scenarios. Names of financial products may differ from those used on trading platforms.
Use, Reproduction, and Analyst Disclosure
This Publication is intended solely for the recipient’s informational use. It may not be copied, transmitted, or distributed in any form, wholly or partially, without prior written permission from CFC.
Analyst Declaration: The Analyst(s) certifies that all opinions expressed in this Publication represent their own independent views and that reasonable care was taken to ensure objectivity. They do not hold securities in the companies mentioned, and their compensation is not linked to the views expressed. CFC’s research and marketing divisions operate independently.
Trading Risk Warning:
Trading in financial products involves significant risk. Leveraged OTC derivatives, such as Contracts for Difference (CFDs) and spot forex contracts, carry a high risk of loss that can potentially exceed initial deposits and may not be suitable for all investors. These instruments do not confer ownership of underlying assets. Investors must carefully evaluate their investment objectives and risk tolerance, and consult independent advisors where appropriate.






تنظمها هيئة الأوراق المالية والسلع
سنشري للاستشارات المالي ش.ذ.م.م


تصل إلينا:
-
دبي
الطابق رقم 6, مبنى رقم 4, ساحة إعمار دبي
وسط مدينة دبي، ص.ب: 65777،
دبي، الإمارات العربية المتحدة -
Abu Dhabi
27th Floor, Office 2701,
Shining Towers, Abu Dhabi, UAE -
Sharjah
29th Floor, Office 2905,
The Business Tower, Sharjah, UAE - +971 (4) 356 2800
- info@century.ae

Century Financial is the presenting sponsor of

ينطوي التداول في المنتجات المالية على مخاطر كبيرة. فالاعتماد على المشتقات المالية المتاحة للتداول خارح البورصة، مثل عقود الفروقات وتداول العملات الأجنبية (الفوركس) الفوري، قد يتسبب في خسائر تتجاوز قيمة الإيداعات الأولية، مما يجعلها غير ملائمة لجميع المستثمرين. فهذه الأدوات المالية المعقدة لا تمنح ملكية مباشرة للأصول الأساسية. لذا، ينبغي للمستثمرين الاحتراز عند تحديد أهدافهم الاستثمارية ومراعاة مستوى المخاطرة المتوقَع، واللجوء إلى الاستشارة المهنية المتخصصة عند الضرورة.
سنشري للإستشارات والتحليل المالي ش.ذ.م.م (الشركة)، شركة مرخّصة ومنظمة من هيئة الأوراق المالية والسلع في دولة الإمارات العربية المتحدة، بموجب الترخيص رقم (20200000028) و(301044) لتولي أعمال الوساطة في الأسواق الدولية، وتداول المشتقات المالية والعملات المتاحة للتداول خارج البورصة في سوق التداول الفوري، بالإضافة إلى تقديم الخدمات الاستشارية والترويجية. تأسست الشركة بموجب قوانين دولة الإمارات العربية المتحدة، وهي مسجلة لدى دائرة التنمية الاقتصادية بدبي (رقم: 768189)، حيث يقع مكتبها المسجّل في 601، الطابق السادس، المبنى رقم 4، ميدان إعمار، وسط مدينة دبي، دولة الإمارات العربية المتحدة، ص.ب. 65777.
لا يُعرَض محتوى هذا الموقع الإلكتروني إلا لأغراض تعريفية تثقيفية بحتة، فلا يمثل عرضًا ولا توصيةً ولا دعوةً لشراء أو بيع أي أوراق مالية أو منتجات مالية.
لا تنوي الشركة استخدام أو توزيع منتجاتها وخدماتها في أي ولاية قضائية حيث يُشكِّل هذا الاستخدام أو التوزيع انتهاكًا للقوانين المحلية أو اللوائح التنظيمية.
