In financial markets, indicators are broadly categorized into three types: leading, lagging, and coincident indicators. Each serves a unique role in decision-making and risk management. Leading indicators aim to predict future movements, while lagging indicators confirm trends after they have begun. Coincident indicators, on the other hand, move in line with the overall economy or market cycle.
Leading and lagging indicators are analytical tools used in trading, investing, and economic analysis to understand market trends, price movements, and business cycles. These indicators help traders anticipate future price action or confirm existing trends.
Leading Indicators Explained
Leading indicators provide early signals of potential price movements or economic changes. Traders rely on them to identify opportunities before trends fully develop, making them especially valuable for short-term trading and early trend entries.
How Leading Indicators Work
Leading indicators analyze price momentum, market sentiment, or economic expectations to forecast future direction. They often change before price action becomes obvious on charts, which is why they are considered predictive rather than confirmatory. Because of their forward-looking nature, leading indicators can sometimes produce false signals. This makes them best used in combination with other tools rather than in isolation.
Leading Indicators Examples in Trading
These indicators often move ahead of the broader business cycle indicators, giving early warnings of expansion or contraction. In economic analysis, leading indicators include stock market performance and consumer sentiment indexes.
| Indicator | Purpose | Best Use Case |
|---|---|---|
| Relative Strength Index (RSI) | Measures overbought and oversold conditions | Reversal and momentum trading |
| Stochastic Oscillator | Compares closing price to price range | Entry timing in ranging markets |
| Commodity Channel Index (CCI) | Identifies cyclical trends | Short-term trend detection |
| Williams %R | Measures momentum | Early reversal signals |
Advantages and Limitations of Leading Indicators
Advantages:
Limitations:
Lagging Indicators Explained
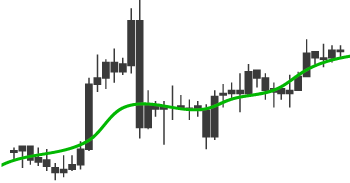
Lagging indicators confirm trends after they are already established. They are widely used by traders to validate signals, manage risk, and identify trend strength. Unlike predictive tools, lagging indicators rely on historical price data, which makes their signals more stable and less prone to market noise.
These indicators are especially useful in trending markets, where the primary goal is to stay aligned with the dominant direction rather than predict short-term reversals. By smoothing price fluctuations, lagging indicators help traders avoid emotional decisions and reduce the impact of sudden volatility.
How Lagging Indicators Work
Lagging indicators are based on historical price data. Since they react after price movements occur, they are slower but generally more reliable than leading indicators. These indicators help traders avoid premature entries and false breakouts. They are especially useful for trend-following strategies and are usually available on modern platforms like the MT5 Platform and Century Trader.
Lagging Indicators Examples in Trading
In macroeconomic analysis, lagging indicators include GDP growth, unemployment rates, and corporate profits. These indicators confirm changes in the business cycle after they have occurred.
| Indicator | Purpose | Best Use Case |
|---|---|---|
| Moving Averages) | Smooth price data | Trend confirmation |
| MACD | Measures trend momentum | Trend strength validation |
| Bollinger Bands | Measures volatility | Trend continuation |
| Average Directional Index (ADX) | Measures trend strength | Filtering weak trends |
Advantages and Limitations of Lagging Indicators
Advantages:
Limitations:
Elevate your trading experience with
Century Trader App
Elevate your trading experience with
Century Trader App

Leading vs Lagging Indicators: Key Differences
Both types of indicators serve different purposes in technical analysis, and choosing the right one depends on whether a trader prefers early signals or confirmed trends. Understanding leading vs lagging indicators helps traders select the right tools based on their strategy, timeframe, and risk appetite.
| Aspect | Leading Indicators | Lagging Indicators |
|---|---|---|
| Signal Timing | Before trend forms | After trend forms |
| Risk Level | Higher | Lower |
| Accuracy | Moderate | Higher |
| Best For | Entry timing | Trend confirmation |
| Trader Type | Aggressive or short-term | Conservative or long-term |
While leading vs lagging indicators differ in timing, they are most effective when used together. For example, a trader may use RSI to identify a potential reversal and then confirm it using moving averages.
Leading, Lagging, and Coincident Indicators in the Business Cycle
The concept of leading lagging coincident indicators is widely used in economic forecasting and long-term investment planning. A consistent rise or fall in these indicators often suggests upcoming shifts in economic momentum.
Coincident Indicators Explained
Coincident indicators move simultaneously with economic activity. They reflect the current state of the economy rather than predicting or confirming future trends.
Examples include:

Industrial Production

Personal Income Levels
Employment Data
Role of Business Cycle Indicators in Trading
Using economic indicators alongside technical indicators improves decision-making across forex trading, CFD trading, and global markets. Business cycle indicators help traders align their strategies with broader economic conditions. For example:
How Traders Use Leading and Lagging Indicators Together
Professional traders rarely rely on a single indicator, as a layered approach reduces false signals and improves consistency. Traders combine leading and lagging indicators to balance early signals with confirmation. This approach helps reduce false entries while still allowing traders to capture meaningful price movements.
A common approach includes:
For example:
RSI identifies oversold conditions
Moving average crossover confirms trend direction
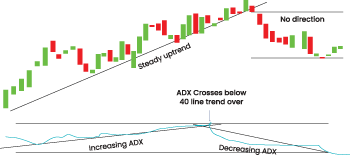
ADX validates trend strength
Conclusion
Analyzing market movements before they happen is what every trader aspires to achieve. Leading and lagging indicators, when used together with an understanding of news and market sentiments, may let you attain just that. But success in markets is not limited to your knack for analysis but the ease of execution on your chosen platform.
At Century Financial Services, traders get access to advanced tools, powerful analytics, and multi-asset trading through the MT5 Platform and Century Trader. Whether you’re trading the share market, building a diversified share basket, or exploring forex trading, commodities, gold trading, or oil trading, Century offers the technology and expertise to support your journey
Frequently Asked Questions
Q1. What is the main difference between leading and lagging indicators?
A: Leading indicators predict future price movements, while lagging indicators confirm trends after they begin. Both serve different purposes and work best when used together.
Q2: Are leading indicators more risky than lagging indicators?
A: Yes, leading indicators carry higher risk because they are susceptible to false signals. Lagging indicators are more reliable but provide delayed entries.
Q3: Which indicators are best for beginners?
A: Beginners can start with moving averages and RSI because they are relatively easy to understand and widely supported on most trading platforms.
Q4. Can leading and lagging indicators be used for forex trading?
A: Yes, they are widely used in forex, commodities, indices, and CFD trading to identify trends and manage risk.
Q5. Do economic indicators affect technical trading strategies?
A: Yes, economic indicators influence market sentiment and volatility, which directly impacts technical indicator performance.
This marketing and educational content has been created by Century Financial Consultancy LLC (“Century”) for general information only. It does not constitute investment, legal, tax, or other professional advice, nor does it constitute a recommendation, offer, or solicitation to buy or sell any financial instrument. The material does not take into account your investment objectives, financial situation, or particular needs.
The opinions expressed by the hosts, speakers, or guests are their own and may change without notice. Information is based on sources we consider to be reliable; however, Century does not guarantee its accuracy, completeness, or timeliness and accepts no liability for any loss arising from reliance on this content.
Trading and investing involve significant risk, and losses may exceed initial deposits. Past performance is not indicative of future results. CFDs and other leveraged products are complex instruments that may not be suitable for all investors. Please ensure you understand how these products work, the associated risks, and seek independent professional advice if necessary.
Century is licensed and regulated by the UAE Capital Market Authority (CMA) under License Nos. 20200000028 and 301044.
Please refer to the full risk disclosure mentioned on our website.

Regulated by CMA
Century Financial Consultancy LLC


.png)
.png)
.png)
.png)
.png)

Reach us:
-
Dubai
6th Floor, Emaar Square Building 4,
Downtown, Dubai, P.O. Box 65777,
Dubai, United Arab Emirates -
Abu Dhabi
27th Floor, Office 2701,
Shining Towers, Abu Dhabi, UAE -
Sharjah
29th Floor, Office 2905,
The Business Tower, Sharjah, UAE - +971 (4) 356 2800
- info@century.ae

Disclaimer: Trading in financial products carries substantial risk. Leveraged over-the-counter (OTC) derivatives, such as Contracts for Difference (CFDs) and spot forex, may result in losses exceeding initial deposits and may not be suitable for all investors. These complex instruments do not confer ownership of the underlying assets. Investors should carefully consider their investment objectives and risk appetite, and seek independent professional advice if necessary.
Century Financial Consultancy LLC (CFC) is licensed and regulated by the Capital Market Authority (CMA) of the UAE under license numbers 20200000028 and 301044 to carry out the activities of Financial Products dealer, Trading Broker in international markets, Trading Broker of OTC derivatives and currencies in the spot market, Introduction, Financial Consultations, and Promotion. CFC is incorporated under UAE law, registered with the Dubai Economic Department (No. 768189), with its office at 601, Level 6, Building No. 4, Emaar Square, Downtown Dubai, UAE, PO Box 65777.
The content on this website is provided solely for informational and educational purposes and does not constitute an offer, recommendation, or solicitation to buy or sell any securities or financial products.
Products and services offered by CFC are not intended for use in any jurisdiction where such use or distribution would breach local laws or regulatory requirements.
⚠️ Alert: Fraudulent Activity Notice
Century Financial Consultancy LLC (“Century”) has become aware of fraudulent individuals and entities impersonating our firm through unofficial websites, social media channels, and messaging applications such as Telegram, WhatsApp, and Discord.
Please be advised:
- Century does not manage investments on behalf of clients.
- Century does not solicit funds or guarantee investment returns.
- Century does not accept or make payments in cash, cryptocurrency, or digital assets.
- We do not conduct business via social media or messaging platforms.
Our only official website is www.century.ae, and all communication is conducted exclusively through verified channels.
We strongly urge the public to remain vigilant, verify the authenticity of any communication claiming to be from Century, and report any suspicious activity. Century disclaims any responsibility for losses arising from dealings with unauthorised or fraudulent parties.
