 Loading ...

Friday, July 10, 2026
Understanding Market Turning Points with Reversal Candlestick Patterns
تم إعداد هذا المنشور من قبل سنشري للاستشارات
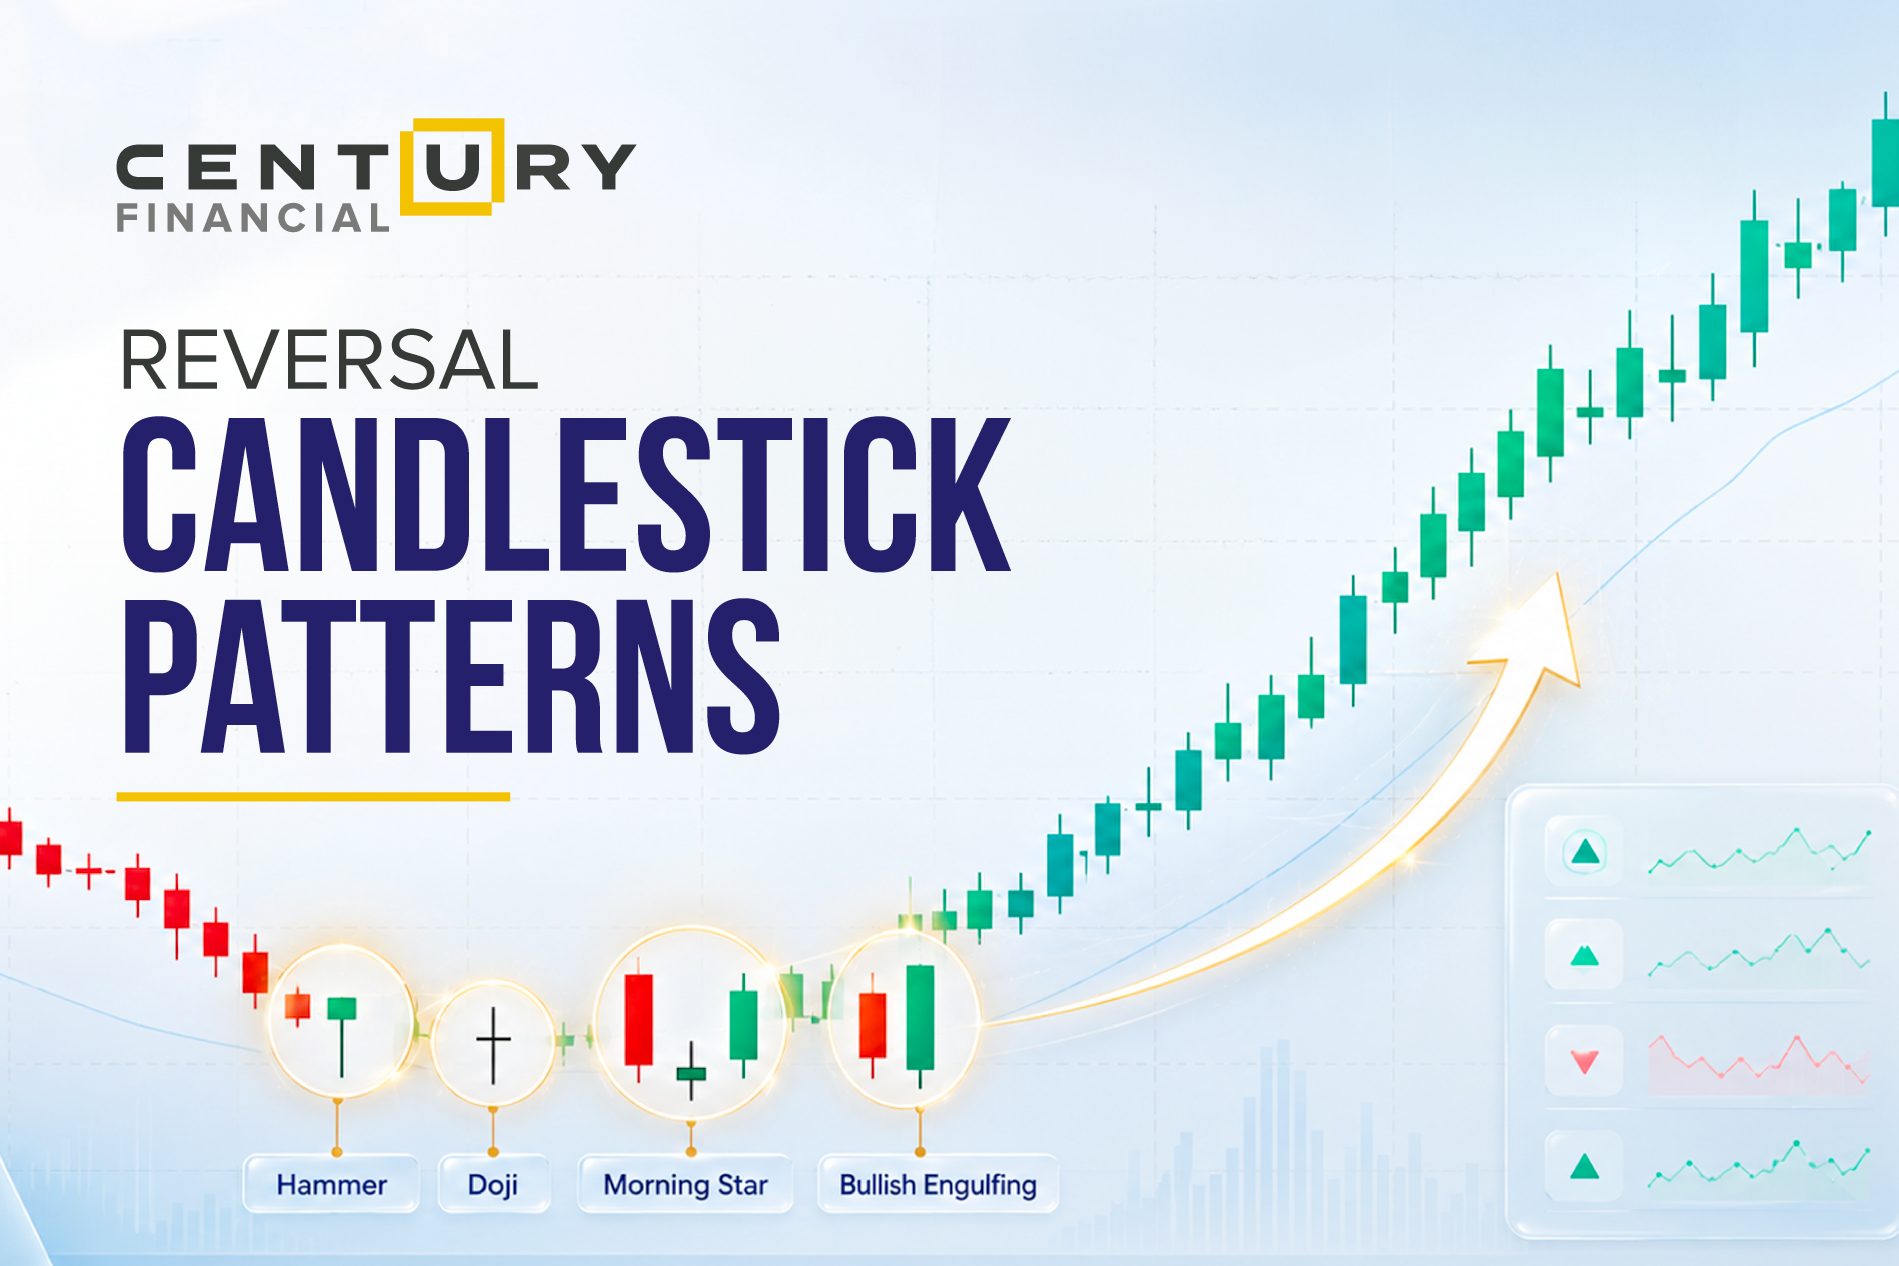
Financial markets are cyclical, and one of the most valuable skills a trader can develop is identifying the turning point of a trend. Certain formations start to emerge when bullish momentum wanes and selling pressure rises, suggesting a potential market reversal. To predict declining price movements, traders frequently employ these signals in bearish pattern trading strategies. Reversal candlestick patterns help traders spot potential changes in market momentum before major price movements take place.
Understanding bearish candlestick patterns is particularly useful for traders who want to identify market tops, protect profits, or open short positions. Whether you trade in the share market, forex, commodities, or global assets such as oil and gold, reversal patterns can provide valuable insights into price action.
Understanding Reversal Candlestick Patterns in Trading
Reversal candlestick patterns indicate that the existing market trend may be losing strength and preparing to change direction. These patterns form when buying pressure weakens or selling pressure increases.
Professional traders combine candlestick analysis with bearish candlestick indicators, support and resistance levels, and trading volume to confirm signals before entering a trade.
Key Characteristics of Reversal Candlestick Patterns
Several factors determine whether a candlestick formation qualifies as a strong reversal signal. Key characteristics include:
Why Reversal Candlestick Patterns Matter for Traders
These signals are widely used on modern platforms such as the Century Trader, where traders can apply technical indicators and analyse price charts in real time. They are popular because reversal patterns help traders:
- Identify potential market turning points
- Improve risk management strategies
- Plan better entry and exit positions
- Recognise bearish price action patterns early
Top Bearish Reversal Candlestick Patterns Every Trader Should Know
These patterns are frequently observed in bearish trading across stocks, commodities, and currency markets and are used by traders extensively, alongside other candlestick indicators, news, and trends.
Bearish Engulfing Pattern
This pattern is considered one of the strongest bearish candlestick patterns for identifying a possible market decline. The bearish engulfing pattern occurs when a large red candle fully engulfs the previous green one. This indicates strong selling pressure entering the market.
Key features:
- Appears after an uptrend
- The second candle completely covers the previous candle's body
- Signals potential trend reversal
Shooting Star Pattern
The shooting star is a single candlestick that forms near the top of an uptrend. This pattern often appears before price drops in markets. It has a small body and a long upper shadow.
Causes:
- Buyers initially push prices higher
- Sellers enter and push the price back down
- Market sentiment shifts from bullish to bearish
Evening Star Pattern
The evening star is a three-candle pattern that signals a possible trend reversal. This formation is commonly seen in bearish chart patterns that mark the end of strong rallies.
Structure:
- The first candle is a strong bullish candle
- The second bullish candle has a small body, indicating indecision
- The third candle is a strong bearish candle
Dark Cloud Cover Pattern
The dark cloud cover pattern forms when a bearish candle opens above the previous bullish candle's high but closes below the midpoint of that candle. Traders frequently combine this pattern with other bearish candlestick indicators for stronger confirmation.
Meaning:
- Initial bullish sentiment
- Sudden strong selling pressure
- Possible trend reversal
Hanging Man Pattern
The hanging man appears at the top of an uptrend and signals weakening buying momentum. This formation usually indicates that sellers are beginning to challenge the uptrend.
Characteristics:
- Small body
- Long lower shadow
- Little or no upper shadow
Table of Strong Bearish Candlestick Patterns and Their Signals
The following table summarises the most reliable bearish technical patterns used by traders.
| Pattern | Type | Market Signal | Strength |
|---|---|---|---|
| Bearish Engulfing | Two candle | Strong reversal after uptrend | High |
| Shooting Star | Single candle | Buyers losing control | Medium to High |
| Evening Star | Three candle | Major bearish reversal | Very High |
| Dark Cloud Cover | Two candle | Increasing selling pressure | Medium |
| Hanging Man | Single candle | Weakening bullish momentum | Medium |
Applying Bearish Reversal Patterns Across Different Markets
These patterns are not limited to a single asset class because they reflect market psychology, which remains consistent across trading environments. Traders use bearish candlestick patterns in the share market, forex trading, commodities, and CFD trading to identify potential trend reversals and plan short positions.
Forex Trading
Traders often use bearish reversal candlestick patterns to identify selling opportunities during trend exhaustion.
Gold Trading
Gold is known for strong technical reactions at key price levels.
Oil Trading
Traders monitoring oil trading often use bearish chart patterns to anticipate price corrections.
Share Market
Reversal patterns help traders identify when a stock may shift from bullish momentum to downward pressure.
CFD Trading
Traders use these signals to manage leverage and adjust open positions on both the instrument and its underlying asset.
Conclusion
Reversal candlestick patterns remain one of the most powerful tools in technical analysis. They provide traders with valuable insights into potential trend changes and help identify when market momentum is shifting from buyers to sellers. By learning how to recognise strong bearish candlestick patterns and combining them with indicators, support and resistance levels, and volume analysis, traders can significantly improve their market timing and risk management.
Century Financial Services provides traders with advanced tools and market access to apply these strategies effectively. Century offers the technology and expertise needed with 24x5 support. Open an account and use our research-backed insights, intuitive platforms, and 35+ years of legacy to support your strategies.
Frequently Asked Questions
What are reversal candlestick patterns in trading?
Reversal candlestick patterns are chart formations that indicate a possible change in market direction. They help traders identify when an uptrend may turn bearish or when a downtrend may reverse into a bullish trend.
How do traders confirm bearish candlestick signals?
Traders confirm signals by combining candlestick analysis with technical indicators, resistance levels, and volume analysis before entering a trade.
Can beginners use bearish candlestick patterns?
Yes. Beginners can learn to identify bearish trading patterns with practice. Using charting tools can help visualise these patterns clearly.
Are bearish patterns useful for all markets?
Yes. Bearish technical patterns are widely used in forex, commodities, stocks, and CFD markets.
لا تقدم شركة سنشري للإستشارات والتحليل المالي ش.ذ.م.م (الشركة) محتوى هذه المدونة، بما في ذلك أي أبحاث أو تحليلات أو آراء أو توقعات أو أي معلومات أخرى (يُشار إليها مجتمعةً باسم "المعلومات")، إلا لأغراض التسويق والتثقيف وإتاحة المعلومات العامة. ولا يُفسَّر ذلك على أنه نصيحة استثمارية أو توصية أو دعوة لشراء أو بيع أي أدوات مالية.
كما يجوز نشر هذه المعلومات عبر قنوات مختلفة، بما في ذلك موقع الشركة الإلكتروني، ومنصات الغير، والنشرات الإخبارية، والمواد التسويقية، ورسائل البريد الإلكتروني، ووسائل التواصل الاجتماعي، وتطبيقات المراسلة، والندوات الإلكترونية، وغيرها من وسائل التواصل. وبينما تسعى الشركة لضمان دقة المحتوى، فإنها لا تضمن اكتماله أو موثوقيته أو تحديثه في الوقت المناسب. وعليه، فأي قرارات تُتخذ بناءً على هذه المعلومات تكون على مسؤوليتك الشخصية. ولا تتحمل الشركة أي مسؤولية عن أي خسارة أو ضرر ناتج عن استخدامها.
ينطوي تداول المنتجات المالية على مخاطر كبيرة، بما لا يتناسب مع جميع المستثمرين. فيُرجى التأكد من وعيك التام بالمخاطر، وطلب الاستشارة المهنية المتخصصة إذا لزم الأمر.
يُرجى الاطلاع على بيان كشف المخاطر الشامل المتوفر على موقعنا الإلكتروني.






تنظمها هيئة الأوراق المالية والسلع
سنشري للاستشارات المالي ش.ذ.م.م


تصل إلينا:
-
دبي
الطابق رقم 6, مبنى رقم 4, ساحة إعمار دبي
وسط مدينة دبي، ص.ب: 65777،
دبي، الإمارات العربية المتحدة -
Abu Dhabi
27th Floor, Office 2701,
Shining Towers, Abu Dhabi, UAE -
Sharjah
29th Floor, Office 2905,
The Business Tower, Sharjah, UAE - +971 (4) 356 2800
- info@century.ae

Century Financial is the presenting sponsor of

ينطوي التداول في المنتجات المالية على مخاطر كبيرة. فالاعتماد على المشتقات المالية المتاحة للتداول خارح البورصة، مثل عقود الفروقات وتداول العملات الأجنبية (الفوركس) الفوري، قد يتسبب في خسائر تتجاوز قيمة الإيداعات الأولية، مما يجعلها غير ملائمة لجميع المستثمرين. فهذه الأدوات المالية المعقدة لا تمنح ملكية مباشرة للأصول الأساسية. لذا، ينبغي للمستثمرين الاحتراز عند تحديد أهدافهم الاستثمارية ومراعاة مستوى المخاطرة المتوقَع، واللجوء إلى الاستشارة المهنية المتخصصة عند الضرورة.
سنشري للإستشارات والتحليل المالي ش.ذ.م.م (الشركة)، شركة مرخّصة ومنظمة من هيئة الأوراق المالية والسلع في دولة الإمارات العربية المتحدة، بموجب الترخيص رقم (20200000028) و(301044) لتولي أعمال الوساطة في الأسواق الدولية، وتداول المشتقات المالية والعملات المتاحة للتداول خارج البورصة في سوق التداول الفوري، بالإضافة إلى تقديم الخدمات الاستشارية والترويجية. تأسست الشركة بموجب قوانين دولة الإمارات العربية المتحدة، وهي مسجلة لدى دائرة التنمية الاقتصادية بدبي (رقم: 768189)، حيث يقع مكتبها المسجّل في 601، الطابق السادس، المبنى رقم 4، ميدان إعمار، وسط مدينة دبي، دولة الإمارات العربية المتحدة، ص.ب. 65777.
لا يُعرَض محتوى هذا الموقع الإلكتروني إلا لأغراض تعريفية تثقيفية بحتة، فلا يمثل عرضًا ولا توصيةً ولا دعوةً لشراء أو بيع أي أوراق مالية أو منتجات مالية.
لا تنوي الشركة استخدام أو توزيع منتجاتها وخدماتها في أي ولاية قضائية حيث يُشكِّل هذا الاستخدام أو التوزيع انتهاكًا للقوانين المحلية أو اللوائح التنظيمية.
