Thursday, February 19, 2026
Mastering Candlestick Indicators for Smarter Market Decisions
By Century Financial in 'Blog'
Candlestick indicators are among the most trusted tools traders use to analyze price action and predict future market movements. Whether you are interested in forex, stocks, or commodities, understanding candlestick charts can give you a significant edge in interpreting market behavior.
Each candlestick represents the battle between buyers and sellers within a specific timeframe, offering valuable insight into momentum shifts, volatility, and potential reversals. Candlestick indicators are especially useful for spotting opportunities in highly liquid instruments, where price reactions often follow clear technical setups.
Here’s more about the tool that throws light on all market movements.
How to Read a Candlestick Chart
Before exploring candlestick patterns, traders must understand how to interpret the basic structure of a candlestick chart. This chart visually represents price action and helps identify the balance between buying and selling pressure within a specific time frame. Each candlestick provides key insights into market sentiment, momentum, and volatility, making it one of the most effective tools for short- and long-term analysis.
The Anatomy of a Candlestick
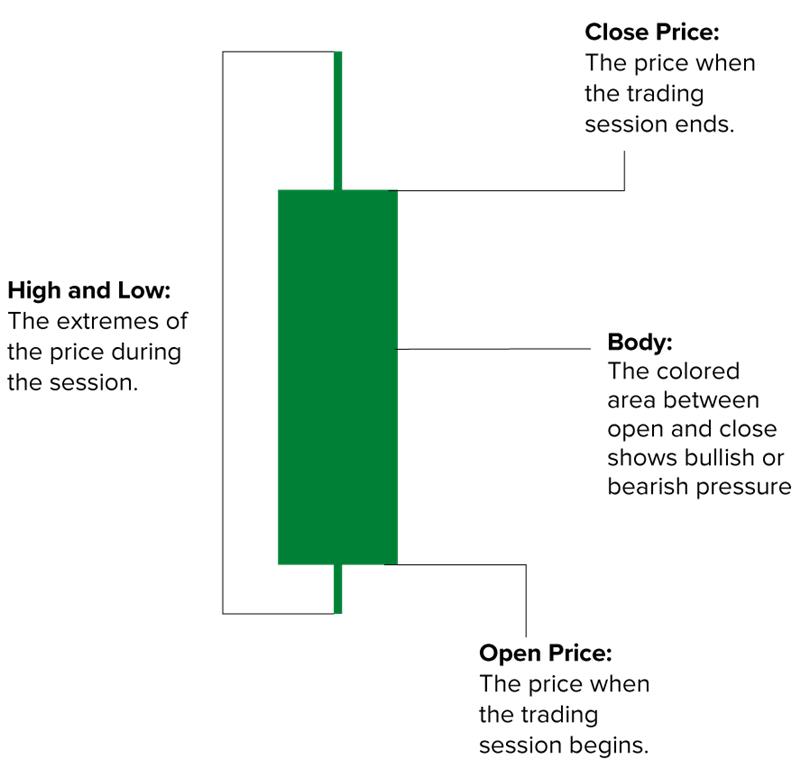
Here’s how to further interpret and understand the trading day with candlesticks:
Why Candlestick Patterns Matter in Trading
When it comes to understanding market sentiment and predicting price movements, candlestick patterns are essential.
These patterns help traders identify potential reversals, trend continuations, or indecision zones, providing valuable insights into the strength and direction of price action. By recognizing and interpreting these visual cues accurately, traders can:
In essence, candlestick patterns help traders make more informed decisions rather than react emotionally to market swings. They serve as a bridge between technical data and real-world trading psychology, giving visual clarity to otherwise complex market behavior.
Bullish Candlestick Patterns
Often indicating the start of an uptrend or the end of a correction, bullish candlestick patterns show that buyers are taking back control of the market. These formations reflect renewed optimism and rising demand, which can drive sustained price growth.
This pattern is a strong reversal signal that occurs at the bottom of a downtrend. It forms when a large bullish candle completely engulfs the previous bearish candle, indicating a decisive shift from selling pressure to buying momentum.
The Hammer Pattern, also known as a candlestick hammer, is a single-candle formation that typically appears after a decline. It has a small real body and a long lower shadow, representing a strong rejection of lower prices.
The Morning Star Pattern is a three-candle formation that signals the end of a downtrend. It starts with a long bearish candle, followed by a small-bodied candle (which can be bullish or bearish), and ends with a strong bullish candle that closes above the midpoint of the first.
The Piercing Line Pattern is a two-candle bullish reversal setup. It forms when the first candle is bearish and the second candle opens below the previous low but closes above the midpoint of the first candle.
A small bullish candle fits within the range of a previous larger bearish candle, signaling weakening selling momentum.
The Three White Soldiers Pattern is one of the most powerful bullish continuation signals. It consists of three consecutive long bullish candles, each opening within the previous candle’s body and closing near the top.
Bearish Candlestick Patterns
Bearish candlestick patterns signal that sellers are taking control of the market, often marking the beginning of a potential downtrend. Recognizing these candle formations helps traders spot ideal exit points and prepare for short-selling opportunities across asset classes, including indices, CFDs, currencies, commodities, and shares.
Traders can better manage risk during volatile sessions by studying these visual cues on a candlestick chart.
In this pattern, a large bearish candle completely engulfs the prior bullish candle, suggesting a strong reversal signal.
Here, a small body with a long upper shadow forms at the end of an uptrend, signalling a bearish reversal.
The evening star pattern is a three-candle pattern that signals the end of an uptrend and the beginning of bearish sentiment.
This pattern resembles a hammer but appears at the top of an uptrend, and warns of potential selling pressure.
In dark cloud cover, a bearish candle opens above and closes below the midpoint of the previous bullish candle, suggesting momentum reversal.
Three consecutive bearish candles signal strong selling and a likely trend reversal.
Neutral and Indecision Patterns
When neither sellers nor buyers have a clear advantage, neutral or indecision candlestick patterns emerge, leaving investors unsure of the market's next move. Such patterns often appear before significant price breakouts or reversals, signalling to traders that they should wait for confirmation before making decisions.
Doji Candlestick
A Doji Candlestick forms when the opening and closing prices are nearly identical, creating a cross-like pattern on the chart. This formation represents a balance between buying and selling forces, reflecting market indecision. Although a Doji alone cannot confirm a reversal or continuation, its context within the trend is significant.
Types of Doji Candlesticks include:
Spinning Top
Another well-liked indecision pattern with long upper and lower wicks and a small real body is the spinning top. This shape indicates that both buyers and sellers were active during the session, but neither dominated, resulting in a narrow closing range.
Real-World Application of Candlestick Indicators
Candlestick indicators are not just theoretical tools. They are a practical part of every seasoned trader’s strategy. Professional traders use them alongside other technical indicators to validate signals and minimize false breakouts.
Professional traders often combine candlestick indicators with other tools like:
For example, imagine a hammer pattern forming near a long-term support zone on the EUR/USD pair. If the RSI also shows oversold conditions and volume spikes, the setup gains significant credibility.
Similarly, in commodities trading, a morning star pattern accompanied by substantial buying volume near support can indicate an early bullish turnaround.
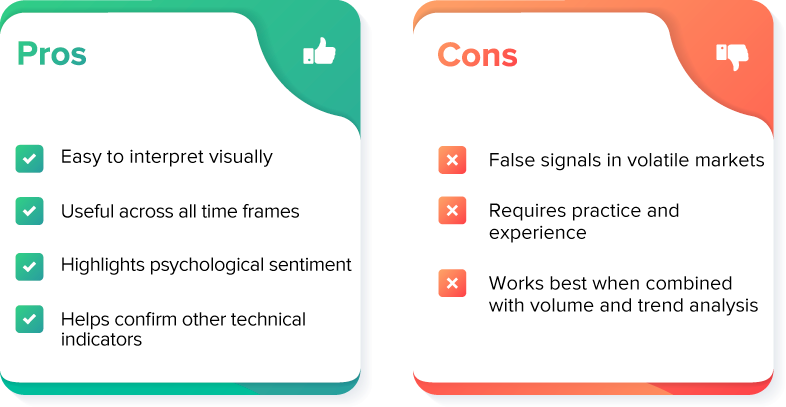
Pros and Cons of Using Candlestick Indicators
Conclusion
Candlestick indicators provide traders with a clear visual representation of price movement and market sentiment. By studying candlestick patterns such as the hammer, engulfing, and doji, traders can anticipate reversals or continuations with greater accuracy. When combined with volume analysis, support and resistance levels, or trend indicators, candlestick charts become a powerful tool for building effective trading strategies.
By analyzing candlestick patterns on a smooth platform, you can make the most of every market movement. Open an account with Century, analyze, and trade in your preferred market. Open your trading account with us!
FAQs About Candlestick Indicators
Q1. What is the main use of candlestick indicators?
A: Candlestick indicators help traders visualize price movements and market sentiment, making it easier to identify trend reversals and continuation signals.
Q2: Are candlestick patterns reliable for forex trading?
A: Yes, candlestick patterns are widely used in forex to identify potential reversals, though they’re most effective when confirmed by other indicators.
Q3: How do I start analyzing candlestick charts?
A: Start by learning basic candlestick patterns and practice on demo platforms such as MT5 or Century Trader before applying them in live markets.
Q4. Can candlesticks be used with other indicators?
A: Yes. In fact, it is always advisable to confirm your analysis with other tools, such as moving averages, news, and volume indicators.
Q5. How many candlestick patterns exist?
A: Traders recognize over 35 classic candlestick patterns, including bullish, bearish, and neutral setups.
Related Reads
This marketing and educational content has been created by Century Financial Consultancy LLC (“Century”) for general information only. It does not constitute investment, legal, tax, or other professional advice, nor does it constitute a recommendation, offer, or solicitation to buy or sell any financial instrument. The material does not take into account your investment objectives, financial situation, or particular needs.
The opinions expressed by the hosts, speakers, or guests are their own and may change without notice. Information is based on sources we consider to be reliable; however, Century does not guarantee its accuracy, completeness, or timeliness and accepts no liability for any loss arising from reliance on this content.
Trading and investing involve significant risk, and losses may exceed initial deposits. Past performance is not indicative of future results. CFDs and other leveraged products are complex instruments that may not be suitable for all investors. Please ensure you understand how these products work, the associated risks, and seek independent professional advice if necessary.
Century is licensed and regulated by the UAE Capital Market Authority (CMA) under License Nos. 20200000028 and 301044.
Please refer to the full risk disclosure mentioned on our website.


Regulated by CMA
Century Financial Consultancy LLC


.png)
.png)
.png)
.png)
.png)

Reach us:
-
Dubai
6th Floor, Emaar Square Building 4,
Downtown, Dubai, P.O. Box 65777,
Dubai, United Arab Emirates -
Abu Dhabi
27th Floor, Office 2701,
Shining Towers, Abu Dhabi, UAE -
Sharjah
29th Floor, Office 2905,
The Business Tower, Sharjah, UAE - +971 (4) 356 2800
- info@century.ae

Disclaimer: Trading in financial products carries substantial risk. Leveraged over-the-counter (OTC) derivatives, such as Contracts for Difference (CFDs) and spot forex, may result in losses exceeding initial deposits and may not be suitable for all investors. These complex instruments do not confer ownership of the underlying assets. Investors should carefully consider their investment objectives and risk appetite, and seek independent professional advice if necessary.
Century Financial Consultancy LLC (CFC) is licensed and regulated by the Capital Market Authority (CMA) of the UAE under license numbers 20200000028 and 301044 to carry out the activities of Financial Products dealer, Trading Broker in international markets, Trading Broker of OTC derivatives and currencies in the spot market, Introduction, Financial Consultations, and Promotion. CFC is incorporated under UAE law, registered with the Dubai Economic Department (No. 768189), with its office at 601, Level 6, Building No. 4, Emaar Square, Downtown Dubai, UAE, PO Box 65777.
The content on this website is provided solely for informational and educational purposes and does not constitute an offer, recommendation, or solicitation to buy or sell any securities or financial products.
Products and services offered by CFC are not intended for use in any jurisdiction where such use or distribution would breach local laws or regulatory requirements.
⚠️ Alert: Fraudulent Activity Notice
Century Financial Consultancy LLC (“Century”) has become aware of fraudulent individuals and entities impersonating our firm through unofficial websites, social media channels, and messaging applications such as Telegram, WhatsApp, and Discord.
Please be advised:
- Century does not manage investments on behalf of clients.
- Century does not solicit funds or guarantee investment returns.
- Century does not accept or make payments in cash, cryptocurrency, or digital assets.
- We do not conduct business via social media or messaging platforms.
Our only official website is www.century.ae, and all communication is conducted exclusively through verified channels.
We strongly urge the public to remain vigilant, verify the authenticity of any communication claiming to be from Century, and report any suspicious activity. Century disclaims any responsibility for losses arising from dealings with unauthorised or fraudulent parties.
