 Loading ...

Wednesday, September 09, 2026
Quantitative Trading Demystified: From Data to Execution
By Century Financial in 'Blog'

Introduction
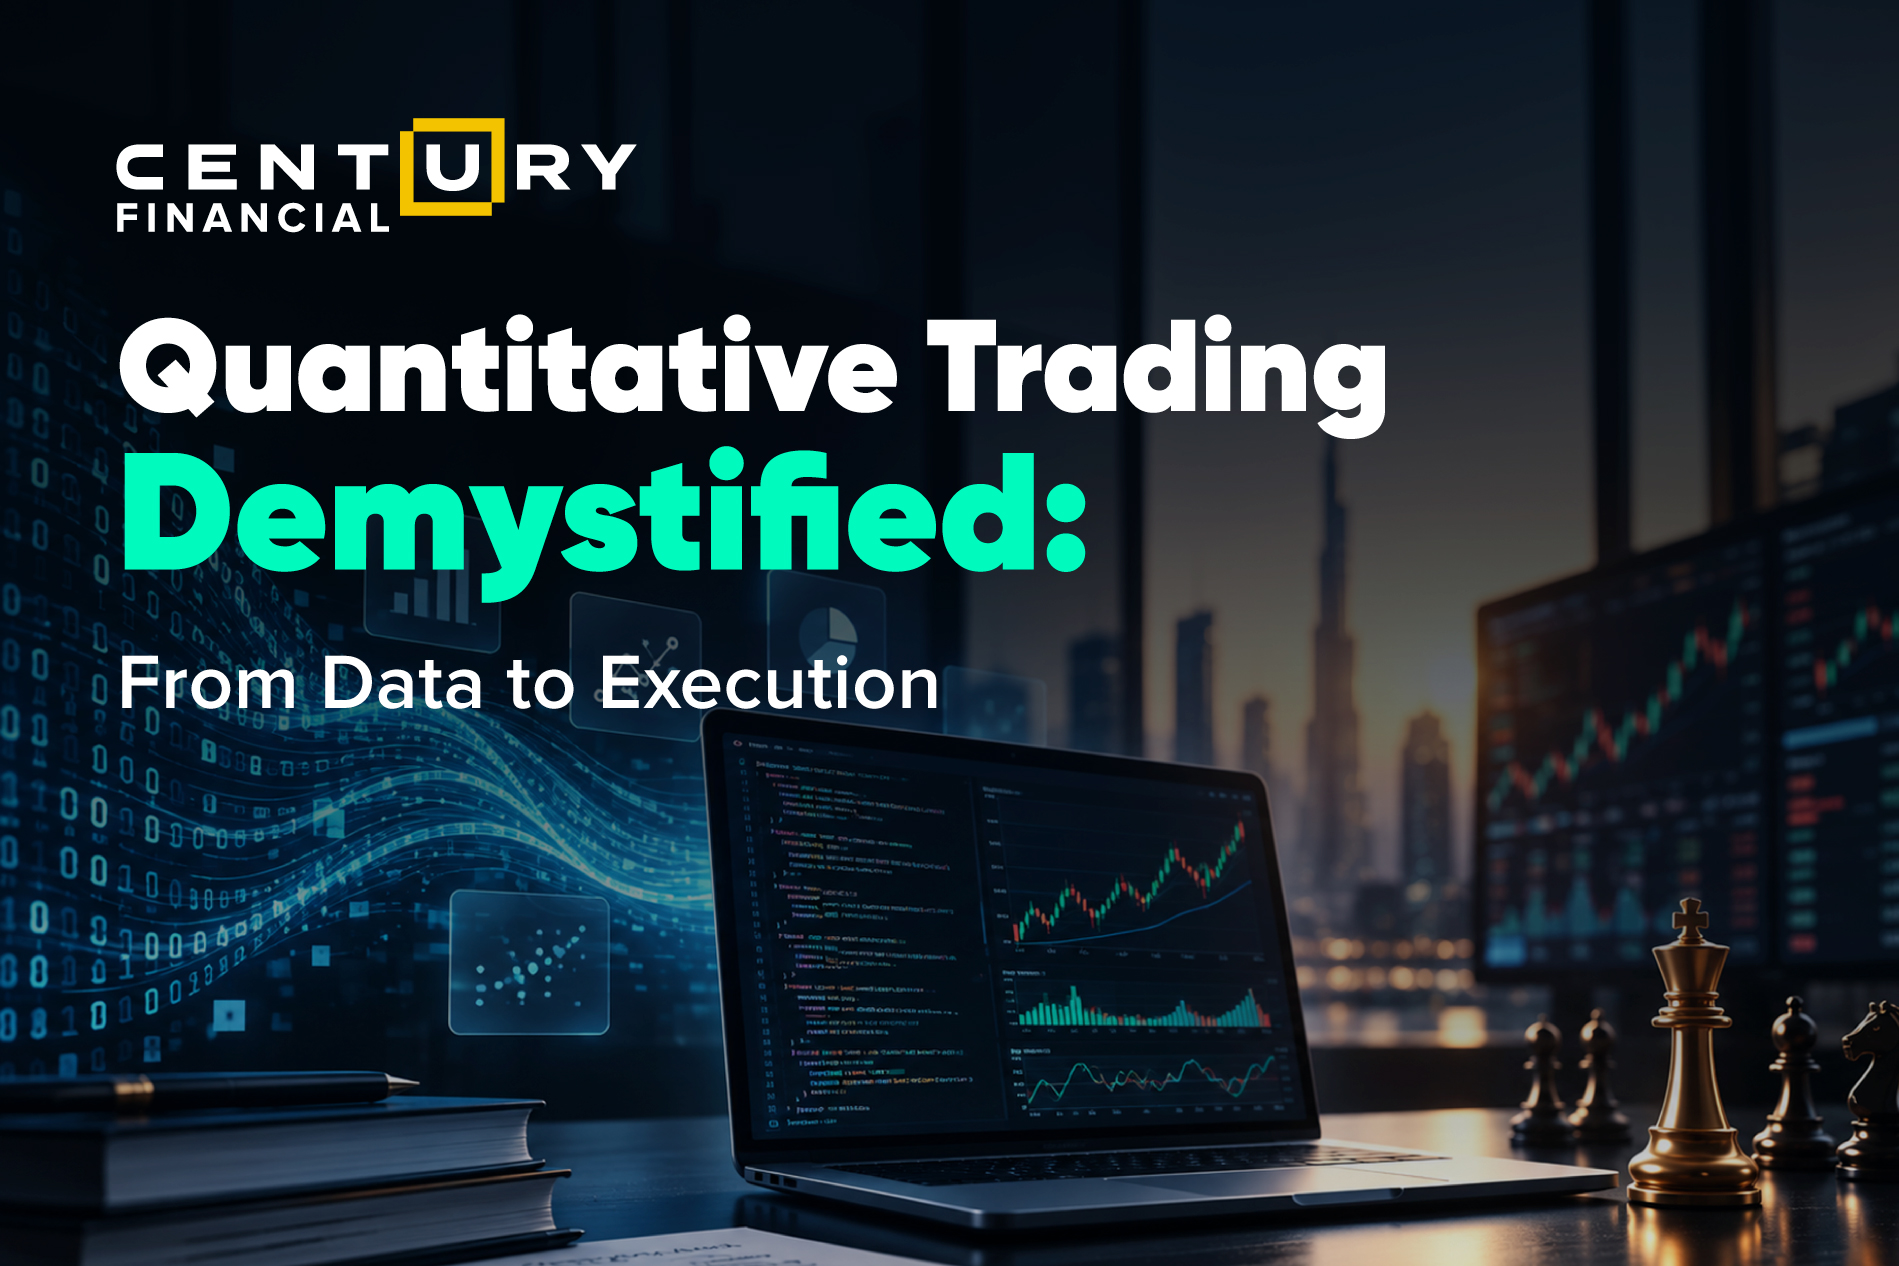
A quiet shift has been happening in how trading decisions get made. Fewer of them start with a hunch about where a market is headed, and more start with a data pull, a spreadsheet, or a model someone spent weeks testing. That shift has a name: quantitative trading, the practice of using mathematics, statistics, and historical data to identify and test trading ideas before any money is actually at risk.
This piece walks through what that looks like in practice, how the process runs from raw data to a live trade, the strategies most commonly built this way, and where quantitative trading overlaps with, and differs from, algorithmic and manual trading.
What Is Quantitative Trading?
Quantitative Trading Meaning
At its simplest, quantitative trading means testing an idea with numbers before acting on it. Someone builds a model, feeds it data, and lets the output, not a feeling, define when to enter or exit a position.
What Is Quantitative Analysis in Trading?
Quantitative analysis applies statistical methods, including regression and correlation analysis, to market data to measure relationships and patterns. It's the analytical foundation a quantitative trading model is built on.
How Quantitative Trading Differs From Traditional Trading
Traditional, or discretionary, trading depends on a trader reading news, charts, and context in real time and deciding from there. Quantitative trading turns that same reasoning into a model that can be tested against years of data long before it touches a live market.
How Does Quantitative Trading Work?
The process usually runs through five connected stages: collecting data, analysing it for patterns, building a model, backtesting that model, and finally executing and monitoring trades. Each stage shapes what the next one can do, and a weak link early on tends to show up later as a bad signal.
Key Components of Quantitative Trading
Five elements tend to show up in any working quantitative approach, and each one leans on the others holding steady. Pull any one of these out and the rest tend to wobble. A model built on incomplete data produces confident, wrong signals, and backtesting without proper risk management can make a reckless strategy look disciplined on paper. The components are:
Quantitative Trading Strategies
Most quantitative strategies fall into a handful of established families, each resting on a different assumption about how prices behave.
| Strategy | Core idea | Signal used | Key risk |
|---|---|---|---|
| Mean reversion | Prices that stray far from an average tend to drift back toward it | Deviation from a historical average, volatility | A market that keeps trending instead of reverting |
| Momentum trading | Instruments already moving in a direction tend to keep moving | Recent price and volume trends | Sharp, sudden reversals |
| Statistical arbitrage | Related instruments show temporary pricing gaps that tend to close | Correlation data across baskets of securities | Correlations breaking down |
| Pairs trading | Two historically correlated instruments are traded against each other when they diverge | The price spread between the pair | A permanent break in that correlation |
| Trend-following | Staying aligned with a prevailing direction across markets | Moving averages, trend indicators | Choppy, range-bound conditions |
Quantitative Trading vs Algorithmic and Manual Trading
Quantitative, algorithmic, and manual trading might seem similar or confusing. Additionally, since a quantitative strategy commonly gets executed through algorithms once the model is built, quantitative vs algorithmic trading blur together in everyday use. They describe different parts of a trade: the analysis behind it, the execution of it, or the human judgment driving it.
What Is Algorithmic Trading?
Algorithmic trading means using pre-programmed rules to execute trades automatically based on variables like price, timing, or volume. It's fundamentally about execution, and it doesn't require a statistical model behind it at all.
How Manual Trading Works
Manual, or discretionary, trading relies on a person reading charts, news, and market context in real time, then placing orders based on that judgment rather than a fixed rule set.
Key Differences Across the Three Approaches
| Approach | Core basis | Decision-making | Execution |
|---|---|---|---|
| Quantitative trading | Statistical and mathematical models | Model-driven, grounded in tested data | May use algorithms, but doesn't require them |
| Algorithmic trading | Pre-programmed rule sets | Rule-based, not necessarily model-derived | Automated by design |
| Manual (discretionary) trading | Trader judgment and market experience | Human interpretation in real time | Orders placed manually |
Benefits of Quantitative Trading
The core appeal of a quantitative approach comes down to structure: decisions that can be tested and repeated rather than shaped by how a trader feels on a given day. Note that none of the following points make a quantitative strategy inherently more profitable than a discretionary one.
Risks in Quantitative Trading
Quantitative trading carries its own set of risks, and most trace back to the model itself rather than the market alone.
The Process in Practice
Everything covered so far, from data to models to backtests, still needs a platform to actually run on. Most traders end up leaning on more than one tool depending on the stage: one for testing an idea against history, another for watching it once it's live, sometimes a third for reaching asset classes the first two don't cover.
Century Financial's platform lineup spans a good part of that range. MT5 and CQG both support the kind of historical data access and charting a backtest depends on, while TWS and IBKR extend that into broader global market access for strategies that cross regions. The Century Trader App keeps monitoring and execution in one place once a model goes live.
Elevate your trading experience with
Century Trader App
Elevate your trading experience with
Century Trader App

Conclusion
Quantitative trading turns market decisions into models built on data, statistics, and historical testing, standing apart from discretionary trading and its dependence on real-time judgment calls. Whichever approach a trader leans toward, the common thread is testing an idea before scaling it and staying on top of it once it's live.
Century Financial's platforms, including MT5, CQG, TWS, IBKR and the Century Trader App, support that kind of process, from data access through to backtesting and execution, alongside tools like Share Baskets for structuring exposure across multiple assets at once. For anyone curious about bringing a more structured, data-led process into their own trading, it might be worth seeing how those tools fit into that workflow.

Frequently Asked Questions
Q1: What is quantitative trading in simple terms?
A: It's the practice of using data, statistics, and mathematical models to identify and test trading strategies, rather than relying on discretionary judgment alone.
Q2: How does quantitative trading work?
A: It typically moves through five stages: collecting market data, identifying patterns, building a model, backtesting it against historical data, then executing and monitoring live trades.
Q3: What are the main quantitative trading strategies?
A: Common strategies include mean reversion, momentum trading, statistical arbitrage, pairs trading, and trend-following, each built on a different assumption about price behavior.
Q4: Is quantitative trading profitable?
A: Profitability depends on the model, market conditions, and execution quality. Backtested performance doesn't guarantee live results, and outcomes vary by strategy and trader.
Q5: What is the difference between quantitative and algorithmic trading?
A: Quantitative trading focuses on the statistical model behind a decision, while algorithmic trading focuses on automated execution. A strategy can use both together.
This marketing and educational content has been created by Century Financial Consultancy LLC (“Century”) for general information only. It does not constitute investment, legal, tax, or other professional advice, nor does it constitute a recommendation, offer, or solicitation to buy or sell any financial instrument. The material does not take into account your investment objectives, financial situation, or particular needs.
The opinions expressed by the hosts, speakers, or guests are their own and may change without notice. Information is based on sources we consider to be reliable; however, Century does not guarantee its accuracy, completeness, or timeliness and accepts no liability for any loss arising from reliance on this content.
Trading and investing involve significant risk, and losses may exceed initial deposits. Past performance is not indicative of future results. CFDs and other leveraged products are complex instruments that may not be suitable for all investors. Please ensure you understand how these products work, the associated risks, and seek independent professional advice if necessary.
Century is licensed and regulated by the UAE Capital Market Authority (CMA) under License Nos. 20200000028 and 301044.
Please refer to the full risk disclosure mentioned on our website.


Regulated by CMA
Century Financial Consultancy LLC


.png)


.png)
.png)

Reach us:
-
Dubai
6th Floor, Emaar Square Building 4,
Downtown, Dubai, P.O. Box 65777,
Dubai, United Arab Emirates -
Abu Dhabi
27th Floor, Office 2701,
Shining Towers, Abu Dhabi, UAE -
Sharjah
29th Floor, Office 2905,
The Business Tower, Sharjah, UAE - +971 (4) 356 2800
- info@century.ae

Disclaimer: Trading in financial products carries substantial risk. Leveraged over-the-counter (OTC) derivatives, such as Contracts for Difference (CFDs) and spot forex, may result in losses exceeding initial deposits and may not be suitable for all investors. These complex instruments do not confer ownership of the underlying assets. Investors should carefully consider their investment objectives and risk appetite, and seek independent professional advice if necessary.
Century Financial Consultancy LLC (CFC) is licensed and regulated by the Capital Market Authority (CMA) of the UAE under license numbers 20200000028 and 301044 to carry out the activities of Financial Products dealer, Trading Broker in international markets, Trading Broker of OTC derivatives and currencies in the spot market, Introduction, Financial Consultations, and Promotion. CFC is incorporated under UAE law, registered with the Dubai Economic Department (No. 768189), with its office at 601, Level 6, Building No. 4, Emaar Square, Downtown Dubai, UAE, PO Box 65777.
The content on this website is provided solely for informational and educational purposes and does not constitute an offer, recommendation, or solicitation to buy or sell any securities or financial products.
Products and services offered by CFC are not intended for use in any jurisdiction where such use or distribution would breach local laws or regulatory requirements.
⚠️ Alert: Fraudulent Activity Notice
Century Financial Consultancy LLC (“Century”) has become aware of fraudulent individuals and entities impersonating our firm through unofficial websites, social media channels, and messaging applications such as Telegram, WhatsApp, and Discord.
Please be advised:
- Century does not manage investments on behalf of clients.
- Century does not solicit funds or guarantee investment returns.
- Century does not accept or make payments in cash, cryptocurrency, or digital assets.
- We do not conduct business via social media or messaging platforms.
Our only official website is www.century.ae, and all communication is conducted exclusively through verified channels.
We strongly urge the public to remain vigilant, verify the authenticity of any communication claiming to be from Century, and report any suspicious activity. Century disclaims any responsibility for losses arising from dealings with unauthorised or fraudulent parties.
