 Loading ...

Introduction
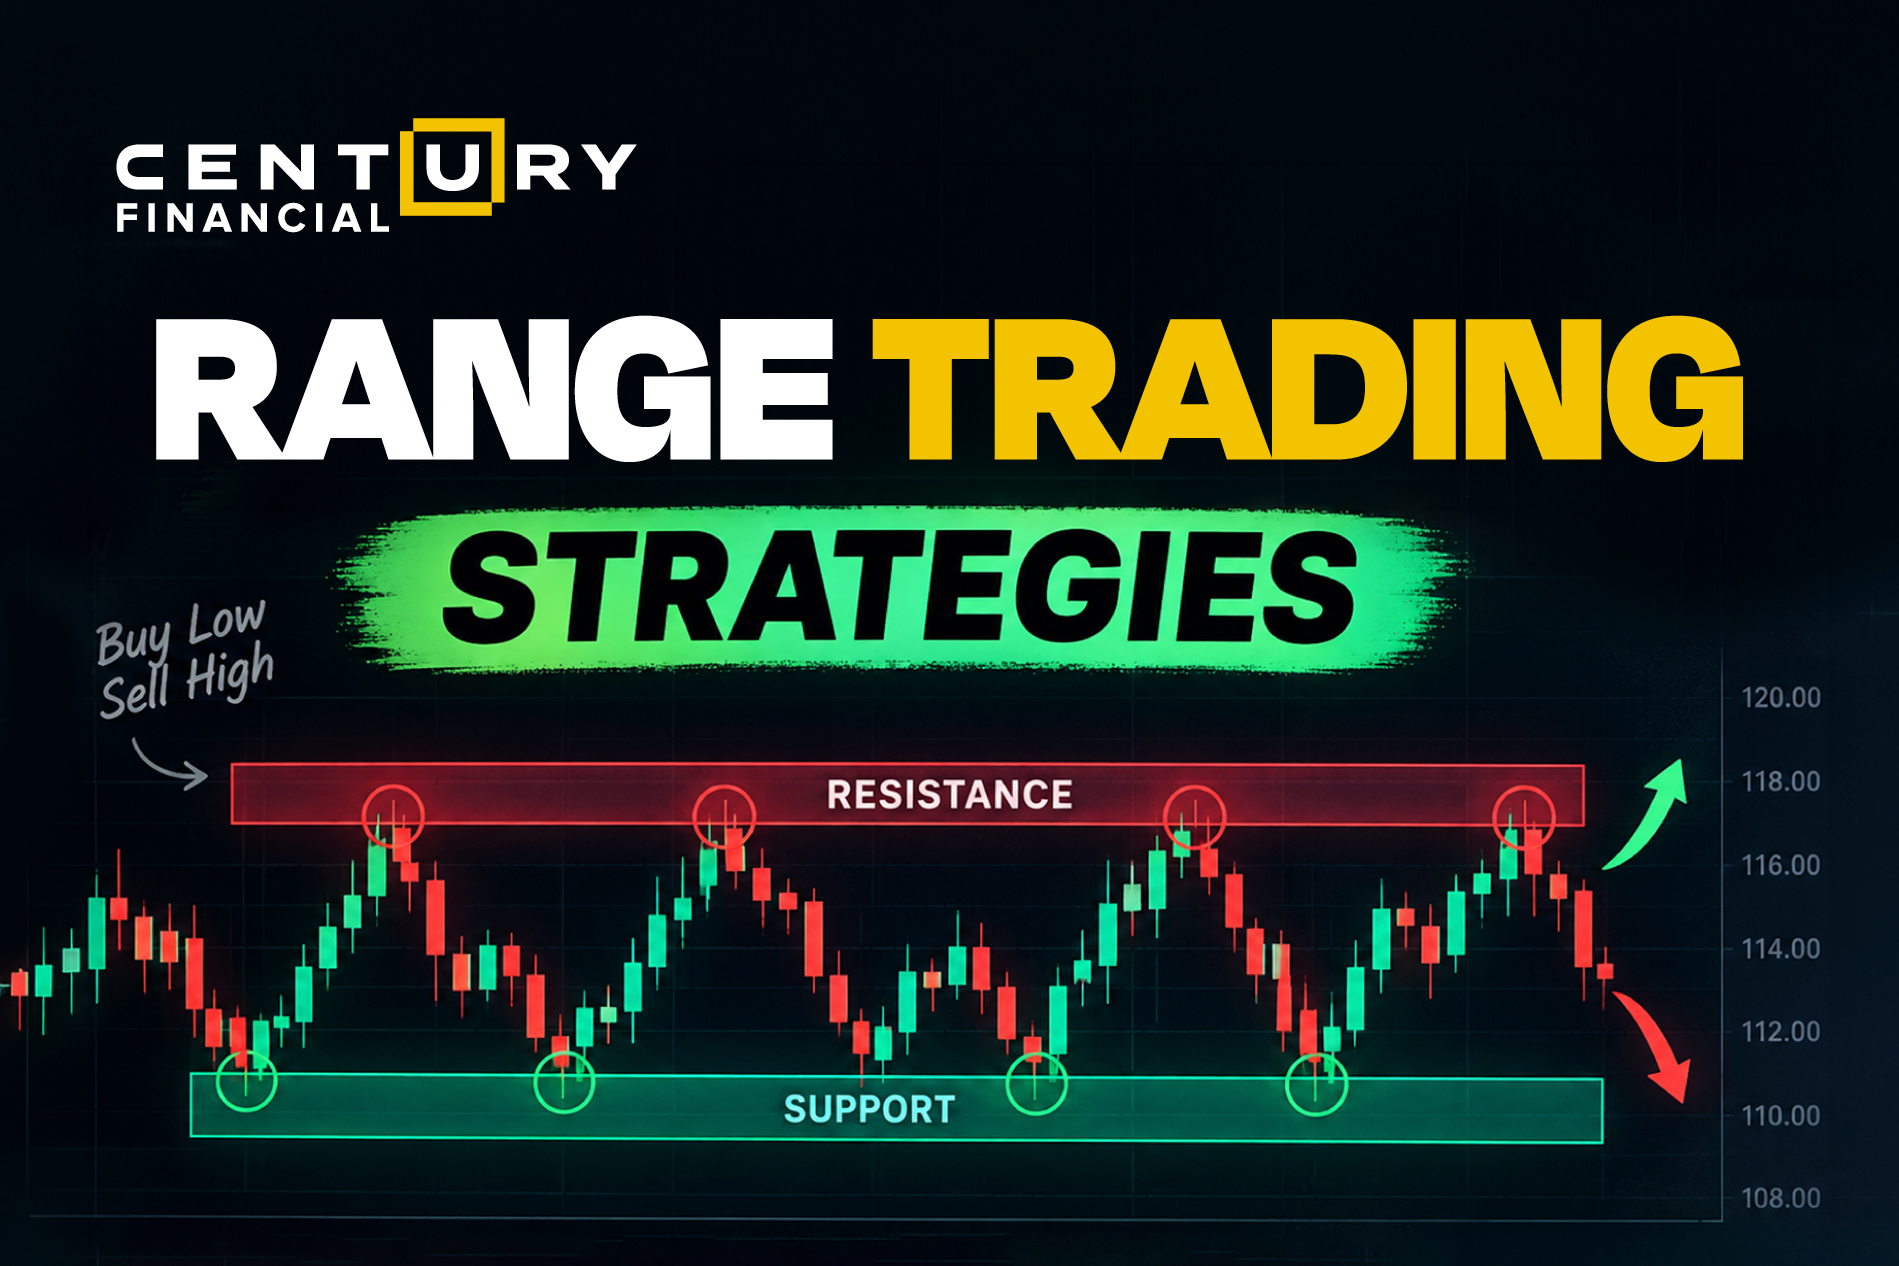
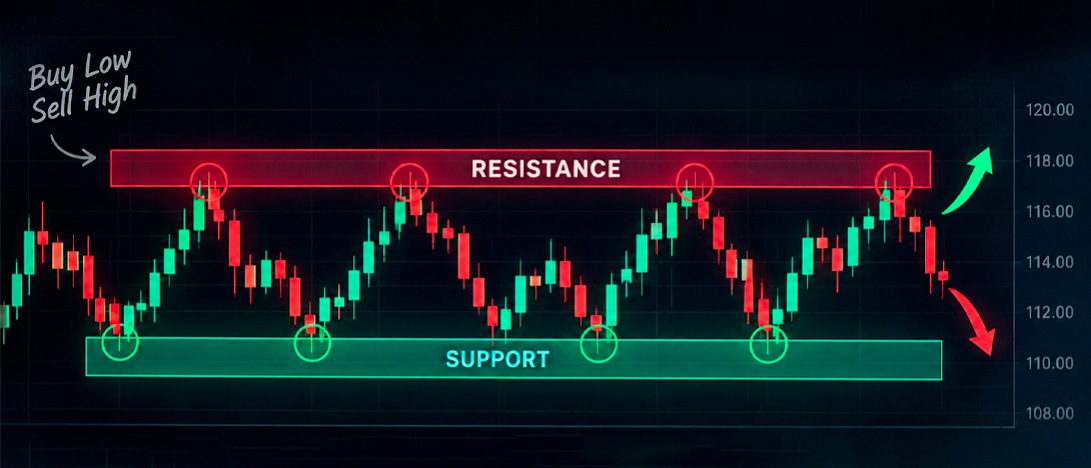
A market doesn't have to be trending to offer a trade. Many instruments spend long stretches bouncing between a fairly consistent floor and ceiling, and range trading is built around that behavior: buying near the floor and selling near the ceiling rather than chasing a direction. It works because markets often spend more time consolidating than most people assume, and traders who wait for a clean trend can end up sitting out much of the tradable price action in between.
This piece covers how to identify a genuine range, when the conditions actually favor trading one, the core strategies built around it, the indicators that help time entries, and the risks that tend to catch range traders off guard.
What Is Range Trading?
How to Identify and Confirm a Trading Range
Spotting a range comes down to reading the same few signals together, since any one of them alone can be misleading.
What Is Range Trading?
How to Trade a Range
Once a range looks genuinely established, the actual trade tends to follow a consistent sequence.
1
Confirm the range is holding, using the support, resistance, and volume signals covered above, rather than acting on the first touch of a level.
2
Wait for price to approach support or resistance again.
3
Look for a confirmation signal at that level rather than trading the touch itself.
4
Set entry and exit levels, typically placing the exit near the opposite boundary.
5
Stop-loss can be placed just beyond the boundary being traded from.
6
Manage the position as price moves toward the opposite side, adjusting or taking partial profit rather than assuming the full move will play out.
Range Trading Strategies
Most range trading approaches fall into four recognizable strategies. They all work within the same boundaries but read the price action inside them differently, so a quick side-by-side view helps before you look at each one in detail.
| Strategy | How It Works | Entry | Exit | Key Risk |
|---|---|---|---|---|
| Support and resistance range trading | Buys near support, sells near resistance, based on the boundaries alone | Reaction at a confirmed boundary | Near the opposite boundary | A boundary that has held before fails |
| Mean reversion | Assumes price drifts back toward the range's average after stretching too far | Price significantly stretched from the average | Near the range's midpoint | The stretch continues instead of reverting |
| Breakout-fade | Bets an apparent breakout will fail and price snaps back inside | Shortly after a breakout attempt loses momentum | Back near the opposite boundary | The breakout is genuine |
| Oscillator-based | Uses momentum indicators to time entries within the range | Oscillator reaches overbought or oversold | Oscillator reverses toward neutral | Oscillator stays extended longer than expected |
Support and Resistance Range Trading
This is the most discretionary of the four approaches, since it leans on how the trader reads price action at the boundary rather than a fixed indicator signal. Many traders scale into a position in parts as a boundary gets tested, treating repeated tests without a break as a sign the level is strengthening rather than about to give way.
Mean Reversion Strategy
Mean reversion trades inside a range tend to run shorter than a full boundary-to-boundary trade, since the snap back toward the average usually happens faster than a move all the way to the opposite side. It also tends to show up more reliably on instruments with a longer history of oscillating around a stable average, rather than ones with a structural drift in one direction.
Breakout-Fade Strategy
Because this trading strategy positions against traders who just entered on the breakout, it tends to demand quicker decision-making and a tighter stop than the other approaches, since being wrong means fighting genuine momentum. Some traders wait for price to retest the broken boundary from the outside before fading it, rather than acting the moment the breakout stalls.
Oscillator-Based Range Trading
An oscillator reading alone rarely gets used in isolation. Most traders only act on an overbought or oversold signal when it lines up with price actually being near a boundary, since the same reading in the middle of the range carries far less weight, and RSI and the Stochastic Oscillator can diverge in timing enough that many traders settle on one as their primary signal rather than trading every flicker from both.
Opening Range Trading Strategy
What Is the Opening Range Strategy?
The opening range is the high and low price a market establishes in the first few minutes after the session opens, and the strategy built around it treats that early range as a smaller version of a normal trading range.
Identifying the Opening Range
The opening range is typically measured over a fixed window; five, fifteen, or thirty minutes after the open are common choices, with the session's high and low over that window marking the range.
Breakout and Entry Rules
Once the opening window closes, a move beyond either boundary with reasonable volume is often treated as an entry signal in that direction, assuming the early range has set the tenor for where the session is likely headed.
Stop-Loss, Targets and Risks
Stops are typically placed back inside the opening range in case the move reverses, with targets set using the opening range size as a rough guide. The main risk is a false breakout in the first hour, a period that can be more volatile and less directional than it initially looks.
Indicators Used in Range Trading
Indicators don't identify a range on their own, but a few can help confirm one and time entries once it's established.
| Indicator | What It Helps Identify in a Range |
|---|---|
| RSI | Overbought and oversold conditions near the range boundaries |
| Stochastic Oscillator | Momentum shifts near support or resistance |
| Bollinger Bands | Whether price is stretched relative to its recent volatility |
| Moving averages | The range's rough midpoint and whether price is drifting toward one boundary |
| ADX | Whether the market lacks trend strength, a condition that favors range trading |
| Volume | Whether a boundary test has enough participation to be meaningful, or is likely to fail |
Range Trading vs Other Trading Strategies
Range trading, trend trading, breakout trading, and mean reversion all describe how price is expected to behave, and mixing them up often creates mismatched expectations about how a trade should play out.
| Approach | Core Assumption | Typical Signal | Key Risk |
|---|---|---|---|
| Range trading | Price stays between defined boundaries | Reaction at support or resistance | A boundary finally breaks |
| Trend trading | Price continues in an established direction | Higher highs and higher lows, or the reverse | A trend reversal |
| Breakout trading | Price will move decisively once a boundary breaks | A boundary break with strong volume | The breakout fails and price returns to the range |
| Mean reversion | Price returns to an average after stretching too far | A significant deviation from the average | The stretch reflects a genuine shift, not noise |
Risks and Common Mistakes in Range Trading
Most range-trading mistakes come down to a handful of recurring problems rather than a long list of separate problems.
Managing Risk When Range Trading
Defining Stop-Loss Levels
A stop is often placed just beyond the range boundary being traded; it limits the loss if that level fails, and placing it too close to the boundary can trigger an exit on ordinary noise rather than a genuine breakout.
Position Sizing
Since range trades often offer smaller likely rewards than trend trades, position size should typically match the range width rather than stay constant across every setup.
Risk-to-Reward Ratio
The distance to the opposite boundary caps a range trade's reward, so the risk-to-reward ratio is worth checking before entry rather than after, particularly when the range itself is narrow.
Knowing When to Stop Trading the Range
Persistent narrowing, declining volume, or a clean break with strong participation are all signs the range may be ending, and continuing to trade it the same way past that point is where losses tend to concentrate.
Elevate your trading experience with
Century Trader App
Elevate your trading experience with
Century Trader App

Is Range Trading Suitable for Beginners?
Advantages of Range Trading
Range trading offers clearly defined entry and exit points. It doesn't require correctly predicting a market's next major direction, which can make the logic more approachable for newer traders.
Limitations of Range Trading
Ranges eventually end, often without much warning, and a strategy built entirely around one can struggle the moment the market starts trending.
What Beginners Should Know Before Starting
Confirming a range with more than one signal, sizing positions to the range's width, and having a plan for what happens if the range breaks are all worth understanding before the first trade, rather than after a boundary fails.
Conclusion
Range trading works by treating a market's established support and resistance as fixed boundaries, entering near one and exiting near the other, and it tends to hold up best in sideways, lower-volatility conditions where ADX readings affirm the absence of a strong trend. Strategies built around it, from straightforward support-and-resistance trades to mean reversion, breakout-fade, and oscillator-based entries, all share the same dependence on the range actually staying intact.
Whichever approach fits a given market, the discipline is the same: confirm the range, size the position to its width, and have a plan ready for the moment it breaks. Century Financial's platforms, including MT5, CQG, TWS, and IBKR, carry the charting tools and indicators, RSI, Bollinger Bands, ADX, and moving averages among them, that support the kind of range confirmation and monitoring this approach depends on. For traders working across multiple markets, consistent tooling can matter as much as the strategy itself.

Frequently Asked Questions
Q1: What is a range trading strategy?
A: It's an approach that buys near a market's support level and sells near resistance, assuming price will continue moving between those two boundaries.
Q2: How do you identify a trading range?
A: By combining a few signals: repeated support and resistance levels, sideways highs and lows, shrinking volume, and a low ADX reading indicating limited trend strength.
Q3: How does support and resistance work in range trading?
A: Support and resistance mark the range's floor and ceiling, and traders typically take positions as price reacts near one of those levels rather than in the middle.
Q4: What indicators are best for range trading?
A: RSI, the Stochastic Oscillator, Bollinger Bands, moving averages, ADX, and volume each help confirm a range or time entries within it, though none identify a range on their own.
Q5: What are the risks of range trading?
A: Key risks include false breakouts, misidentifying the range, sudden trends that end the range, low liquidity, and position sizing or leverage that doesn't account for the range's width.
This marketing and educational content has been created by Century Financial Consultancy LLC (“Century”) for general information only. It does not constitute investment, legal, tax, or other professional advice, nor does it constitute a recommendation, offer, or solicitation to buy or sell any financial instrument. The material does not take into account your investment objectives, financial situation, or particular needs.
The opinions expressed by the hosts, speakers, or guests are their own and may change without notice. Information is based on sources we consider to be reliable; however, Century does not guarantee its accuracy, completeness, or timeliness and accepts no liability for any loss arising from reliance on this content.
Trading and investing involve significant risk, and losses may exceed initial deposits. Past performance is not indicative of future results. CFDs and other leveraged products are complex instruments that may not be suitable for all investors. Please ensure you understand how these products work, the associated risks, and seek independent professional advice if necessary.
Century is licensed and regulated by the UAE Capital Market Authority (CMA) under License Nos. 20200000028 and 301044.
Please refer to the full risk disclosure mentioned on our website.





Regulated by CMA
Century Financial Consultancy LLC


.png)


.png)
.png)

Reach us:
-
Dubai
6th Floor, Emaar Square Building 4,
Downtown, Dubai, P.O. Box 65777,
Dubai, United Arab Emirates -
Abu Dhabi
27th Floor, Office 2701,
Shining Towers, Abu Dhabi, UAE -
Sharjah
29th Floor, Office 2905,
The Business Tower, Sharjah, UAE - +971 (4) 356 2800
- info@century.ae

Disclaimer: Trading in financial products carries substantial risk. Leveraged over-the-counter (OTC) derivatives, such as Contracts for Difference (CFDs) and spot forex, may result in losses exceeding initial deposits and may not be suitable for all investors. These complex instruments do not confer ownership of the underlying assets. Investors should carefully consider their investment objectives and risk appetite, and seek independent professional advice if necessary.
Century Financial Consultancy LLC (CFC) is licensed and regulated by the Capital Market Authority (CMA) of the UAE under license numbers 20200000028 and 301044 to carry out the activities of Financial Products dealer, Trading Broker in international markets, Trading Broker of OTC derivatives and currencies in the spot market, Introduction, Financial Consultations, and Promotion. CFC is incorporated under UAE law, registered with the Dubai Economic Department (No. 768189), with its office at 601, Level 6, Building No. 4, Emaar Square, Downtown Dubai, UAE, PO Box 65777.
The content on this website is provided solely for informational and educational purposes and does not constitute an offer, recommendation, or solicitation to buy or sell any securities or financial products.
Products and services offered by CFC are not intended for use in any jurisdiction where such use or distribution would breach local laws or regulatory requirements.
⚠️ Alert: Fraudulent Activity Notice
Century Financial Consultancy LLC (“Century”) has become aware of fraudulent individuals and entities impersonating our firm through unofficial websites, social media channels, and messaging applications such as Telegram, WhatsApp, and Discord.
Please be advised:
- Century does not manage investments on behalf of clients.
- Century does not solicit funds or guarantee investment returns.
- Century does not accept or make payments in cash, cryptocurrency, or digital assets.
- We do not conduct business via social media or messaging platforms.
Our only official website is www.century.ae, and all communication is conducted exclusively through verified channels.
We strongly urge the public to remain vigilant, verify the authenticity of any communication claiming to be from Century, and report any suspicious activity. Century disclaims any responsibility for losses arising from dealings with unauthorised or fraudulent parties.
